


If you are an investor, it certainly has been a bumpy ride for the past couple of weeks. Markets have been quite volatile. For the first three days of this week, the bears were ready to call a market correction. Only until Thursday and Friday did the bulls come out to try to hold up the 50 DMA. With the earnings season wrapping up, it looks like the corporate economy is on a much stronger footing than the prior year.
As we discussed in our last blog, there are plenty of calls for a market-topping and a +10% market correction. Right now, the S&P 500 is sitting less than 3% off its all-time high and is over 10% for the year. And as we shown in earlier blogs this year, market dips have been instantly bought up by investors. Since November of 2020, market pullbacks have been shallow with each one being less than 4%.
With all the inflation noise, talks of corporate tax increase, stagnant employment data, there is plenty of noise that is currently limiting the market upside. Right now, the market seems to be currently pricing in all the noise.
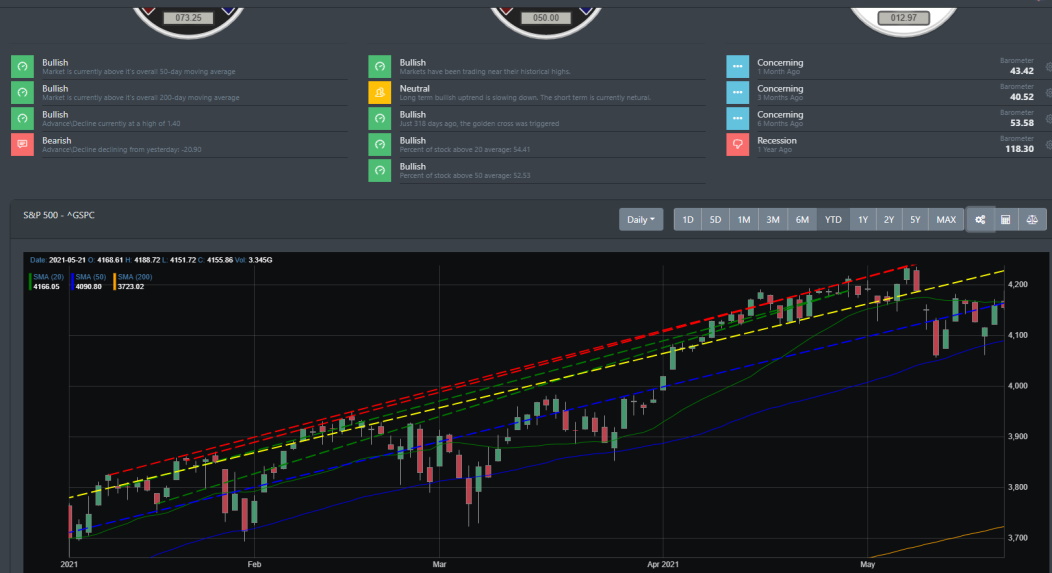
Big Picture
The S&P 500 enter this week sitting near its all-time high. The Nasdaq was looking down the barrel of a 4-week slide. Analysts have been calling on a major correction for the past couple of months and it looked like the markets were ready to turn over. With the 50 DMA on the line, the bulls came out to close the S&P near its all-time high. Nasdaq also broke its losing streak to offer a modest gain for the week. Right now, markets are in a wait and see as they digest the daily noise discussed earlier.
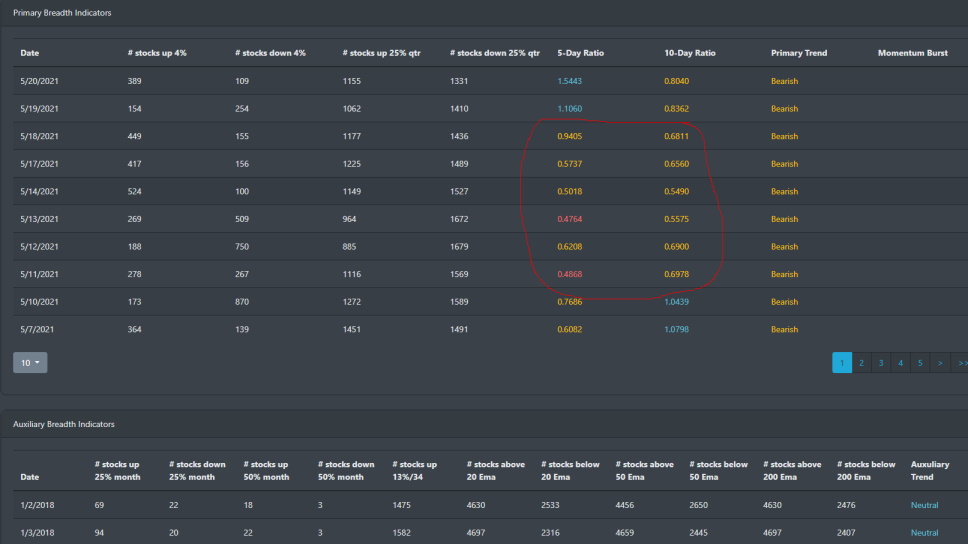
Market Breadth Table
For the majority of May, the rally has clearly stalled. The trend is turning bearish though Thursday and Friday finally sent the 5-day to 10-day ratio turning bullish. For the past 2 weeks, the broader market has avoided any kind of capitulation that would induce a market correction. The number of stocks above their 50 and 200 EMA is still high. There is no bearish divergence to be seen at the current readings.
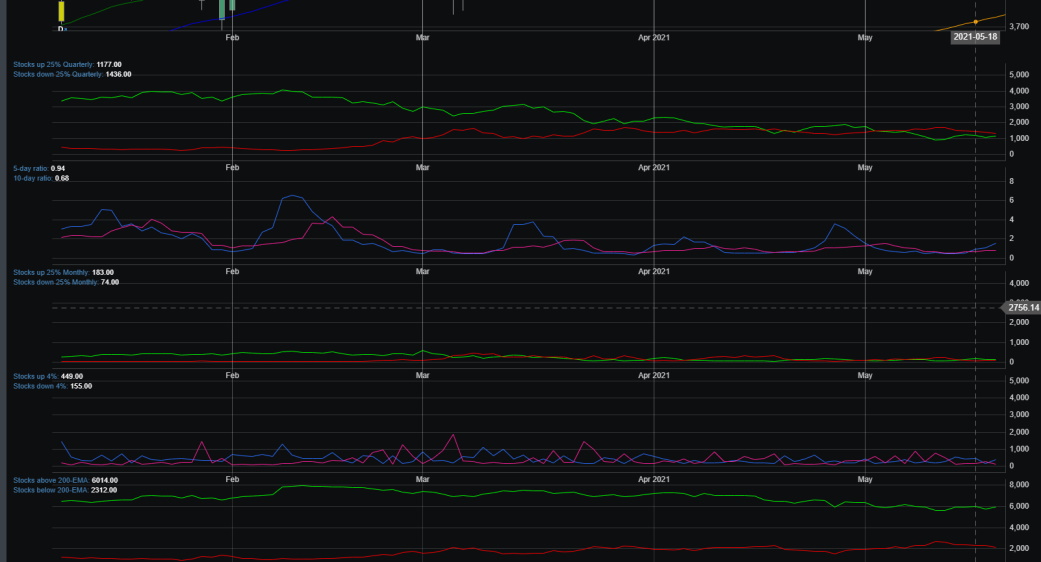
Market Breadth Chart
Markets direction is still in a sideways pattern the 5 day and 10-day ratio have oscillated for the past month. Stocks up 25% quarterly also turn bearish earlier in May.
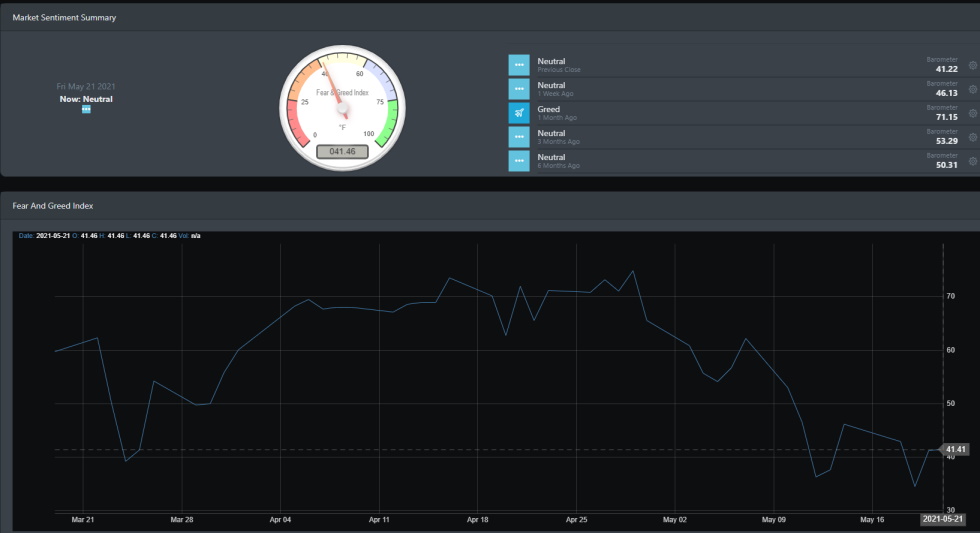
Market Sentiment
According to BullGap's market sentiment, complacency has left the building. In April, we were highlighting how bullish market participants have become. The index was posting an average of +65 over the entire month of April which historically is accompanied by a quick market drop. This is typical as this index should be used as a tool to caution investors when the index becomes extreme at either end of the spectrum.
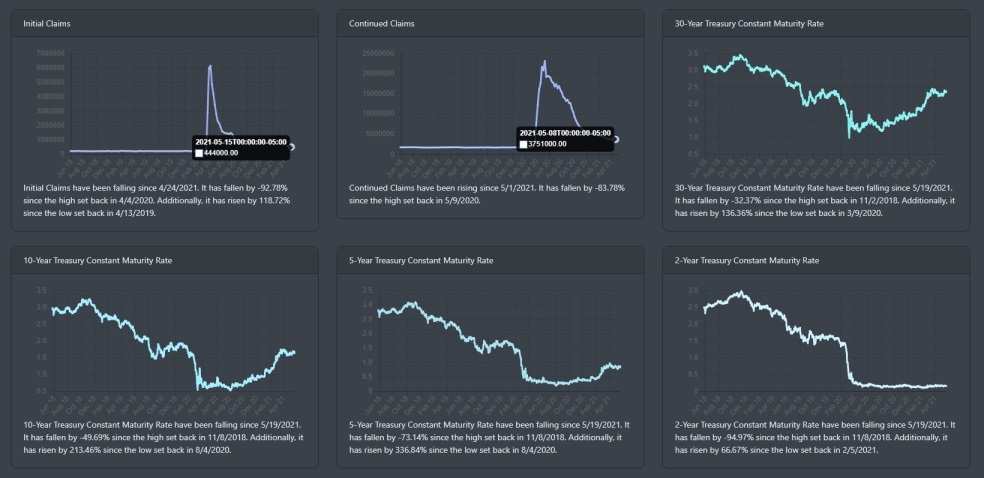
Economic Outlook
The labor market continues to be the outlier in the economy. With the re-opening occurring and many V-shape recoveries in retail, housing, and industrial - there is a clear disconnect between small businesses seeing demand and growth but are being held back by lack of qualified labor. There is clear labor supply issues as business owners are raising compensation, offering bonuses but are finding it hard to find qualified employees. Right now, the current incentive for coming back to work is just not there.
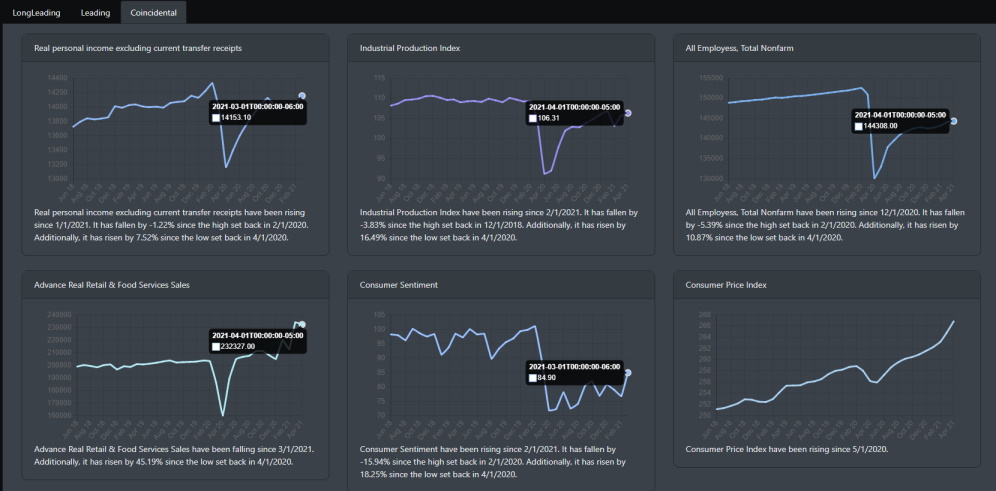
The coincidental data is strong. Personal income excluding current transfer receipts is near pre-pandemic levels. Advance Retail and Food services have skyrocketed and the industrial production index is quite bullish.
Market Outlook
Markets is at a standstill and currently trying to figure out which way to move. Keep in mind that all major indexes have posted a huge rally since the March 20 lows and technically it currently at a mark where it is consolidating all those gains. The next break up or down will most likely tell the next short-term move.
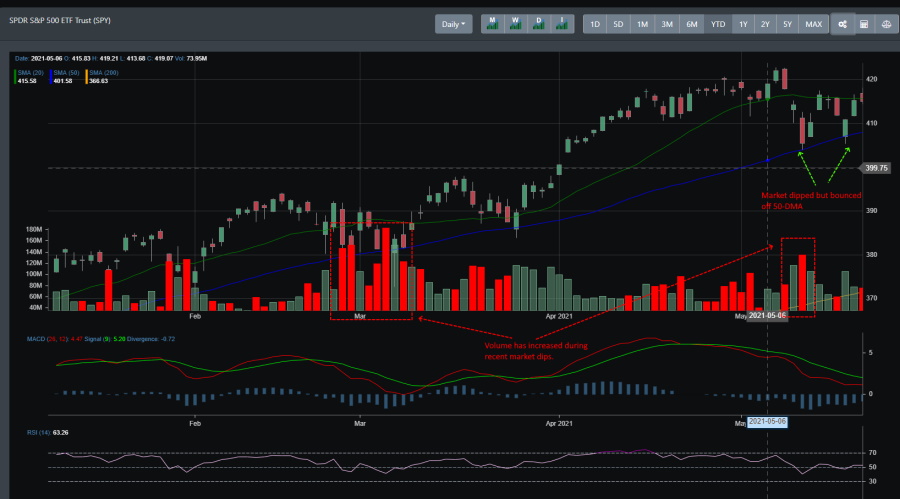
SPY
There is a battle being fought between the bulls and bears over the 50-DMA line. Twice in the last couple of weeks did SPY threaten to drop below the 50 DMA. Only to be counter by buying to keep it above the support line. The weekly MACD is turning bearish but there is a short-term bullish movement on the daily technicals that may indicate a short-term move higher (though limited).
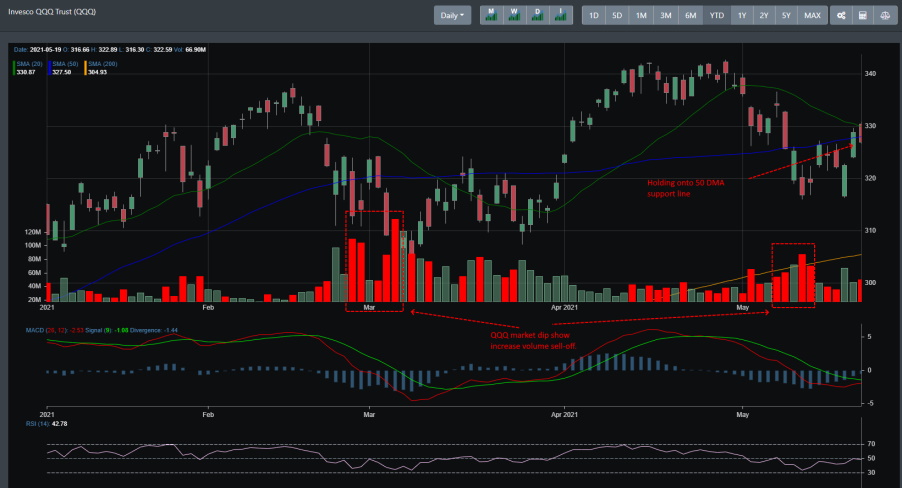
QQQ
Large-cap has been quite volatile for the past couple of months. Prices have fluctuated between several price points of support and resistance. QQQ weekly MACD sell signal hit earlier this week and so did the price action. The daily MACD is getting closer to crossing over which if it does could help push a small reflexive rally.
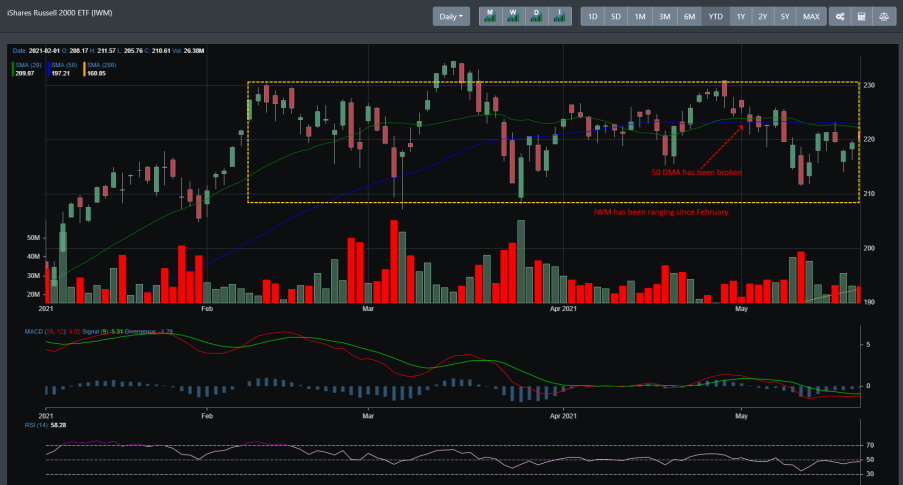
IWM
IWM has been one of the clear winners during the march low rally. It has been consolidating since mid-February. Its MACD sell signal trigger in mid-March but like SPY its daily MACD buy signal is close to crossing over. This cross-over may be short-lived as there is still a lot of downward pressure on SPY overall.
Concluding
The past couple of weeks have been turbulent for the markets. The S&P 500 now sits at around 4155 and is off 1.8% from its early May high. Though we are seeing increasing volume during the pullback, the sell-off has been technically sound. With all major indexes posting highs from the March 20 lows, it is healthy to see markets relieve some of the overbought conditions. At Bullgap, we still hold to our projection that the S&P 500 will reach a target of at least 4300 in 2021. In the coming weeks, markets will continue to consolidate as investors digest information from inflation, labor, inflation, and the Feds. From there, we expect to see the Q2 earnings season help kick-start the markets again. With another jolt of strong beats, we see markets pushing higher.