


Markets have recently been on a subdue rally where in the past 3 weeks it has yet to hit a new historical high. However, both the S&P 500 and Dow Jones (DIJA) came close to hitting all-time highs. On Friday, the S&P 500 index came in above 4232 while the Dow hit near highs at +34,777. There has been a lot of noise lately regarding investor concern over the possibility that price inflation causing the Feds to taper off their support of the market (liquidity) and focus on rising prices. The Federal Reserve is convinced that inflation is only transitory and that they plan on keeping rates constant for the foreseeable future.
On the world front, Global PMIs were released this week showing a strong GDP growth. OECD expects the world economy to expand by 5.8% this year. And J.P. Morgan Global Manufacturing PMI posted a 56.0 which is the highest level in over 10 years. With economies reopening, business conditions are starting to improve and expand.
With all the strong economic data coming out from both the U.S and globally, you would be hard-pressed to find any good news about the current financial markets. There are plenty of pundits that seem to find fault in the current situation and are calling for a severe market correction. They have been calling for one since the secular Bull started back in June 2009. If you are in this camp, you most likely missed out on the 10+ year bull market that is currently still underway.
Big Picture
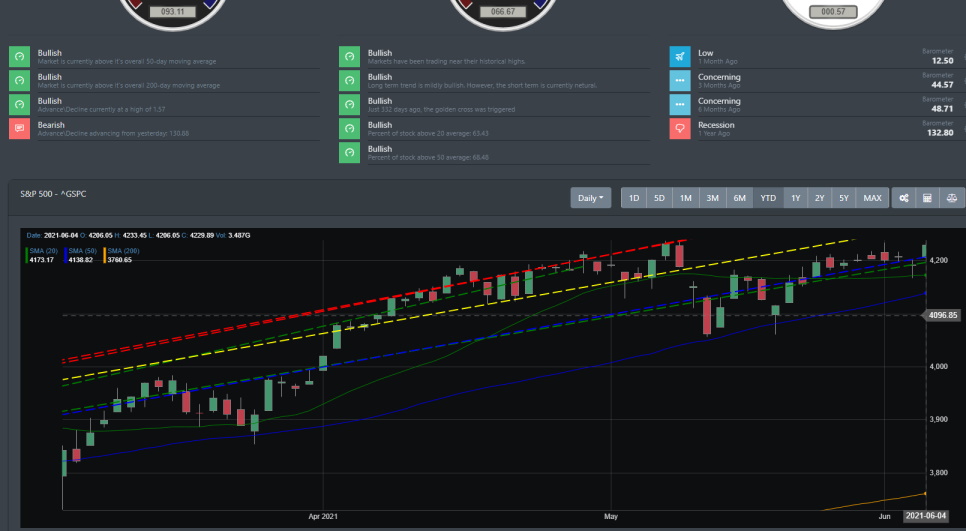
The market landscape looks like it is gearing up for a potentially strong start to the summer. There is a bullish breakout on the advance-decline where the A-D line hit a new high in late May. From the chart below, the S&P 500 broke above its average trend line (dotted blue) and is now poised to move higher in the next few weeks.
For this week, oil was in a strong rally with a trading session ending close to its 52-week high. The S&P 500 started off the week strong but dropped on Thursday to the average support line of 4180. With a strong push on Friday, the S&P 500 and Dow found their way near an all-time high. Nasdaq also pushes +1.4% gains on Friday.
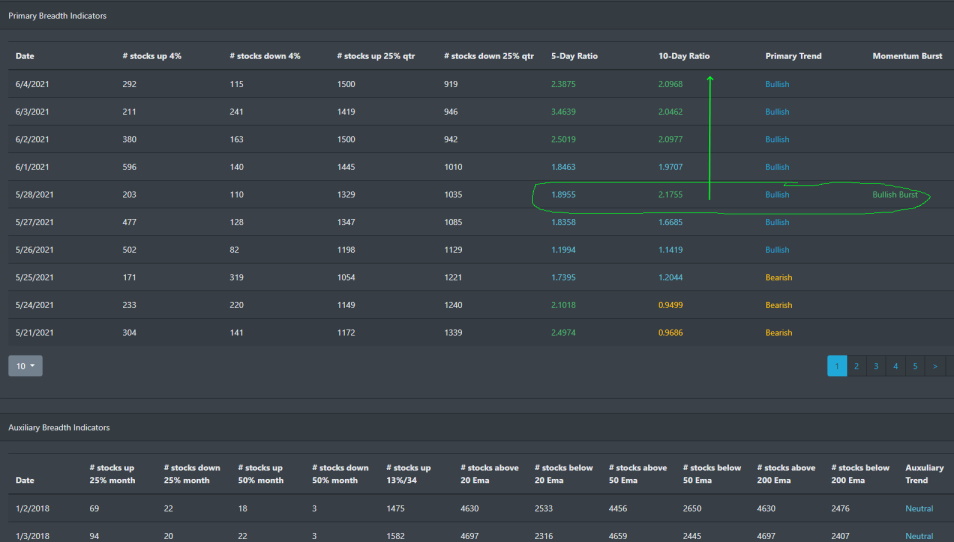
Market Breadth Table
Market participation is starting to heat up. After the consolidation phase of May, June is looking like it is ready to start the summer rally. With a bullish burst signal at the end of May, momentum has been increasing. The number of stocks above their 20, 50, and 200 EMA are increasing.
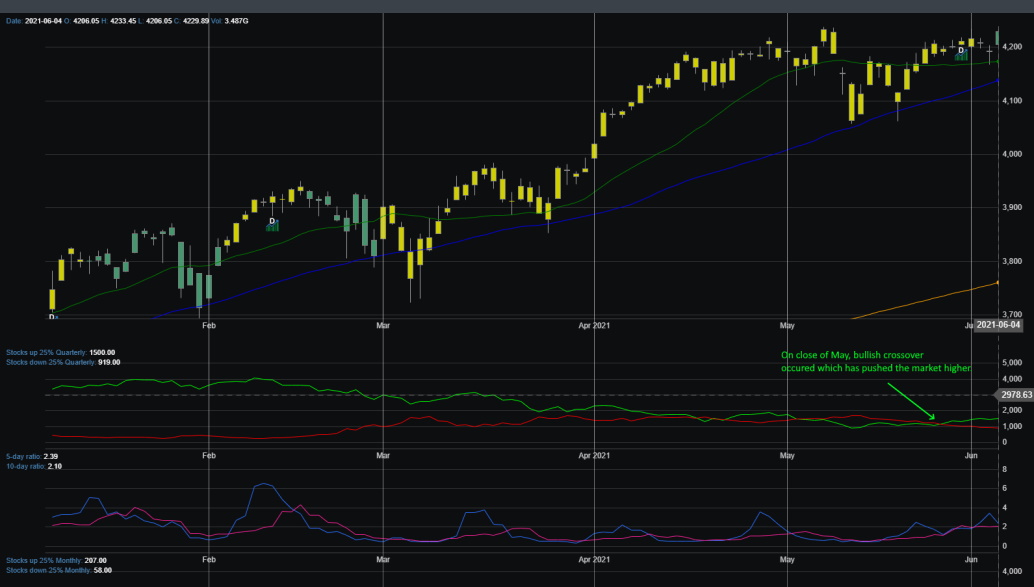
Market Breadth Chart
At the end of May, stocks up 25% quarterly have had a bullish cross-over. This bullish crossover has historically meant momentum is picking up as more market participants are entering the market.
Economic Outlook
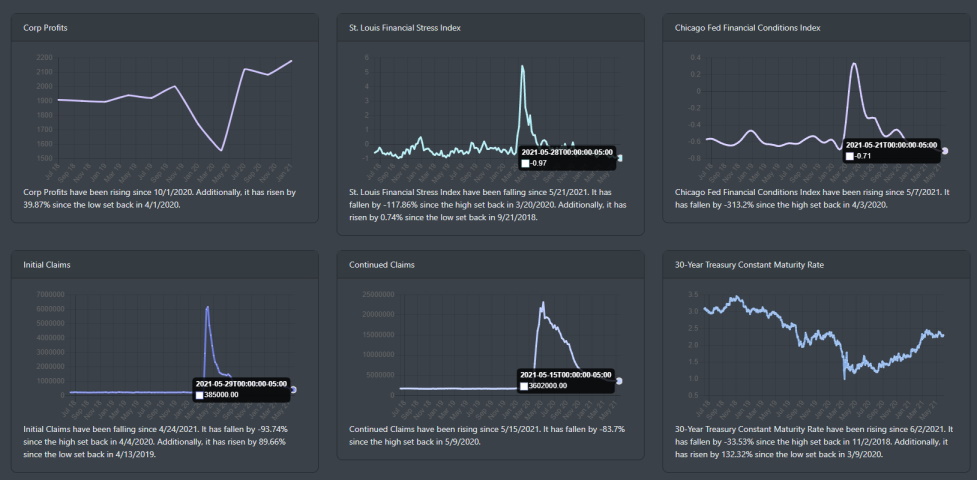
With the economic reopening, economic data is pointing to a strong expansion. The issue currently in play though is that there is a labor shortage that is causing a speed bump. May non-farm payroll report came in at roughly 559K versus estimates of 671K. However, the unemployment rate is now ticking lower at 5.8%. With +20 states planning on ending the extended unemployment package, the hope is that the unemployment rate will continue to trend lower.
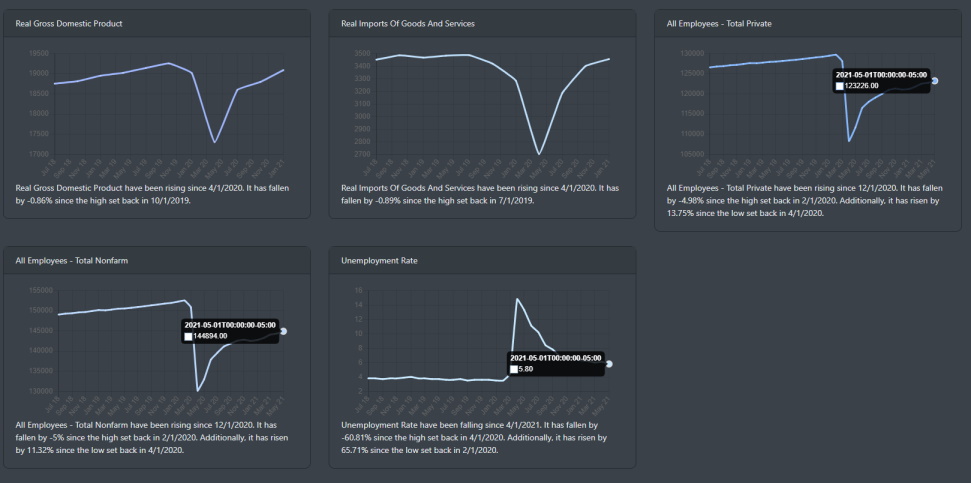
Economic indexes such as the St. Louis Financial Stress Index and Chicago Conditions Index are now at pre-pandemic levels.
Market Outlook
For this week, the moves in the market have been positive though modest. Small-caps were the clear winner this week with large-caps not too far behind. Energy with oil was the top-performer and real estate continues to remain strong (due to lower interest rates). Health care and consumer discretionary were the poor performers for the week.
SPY
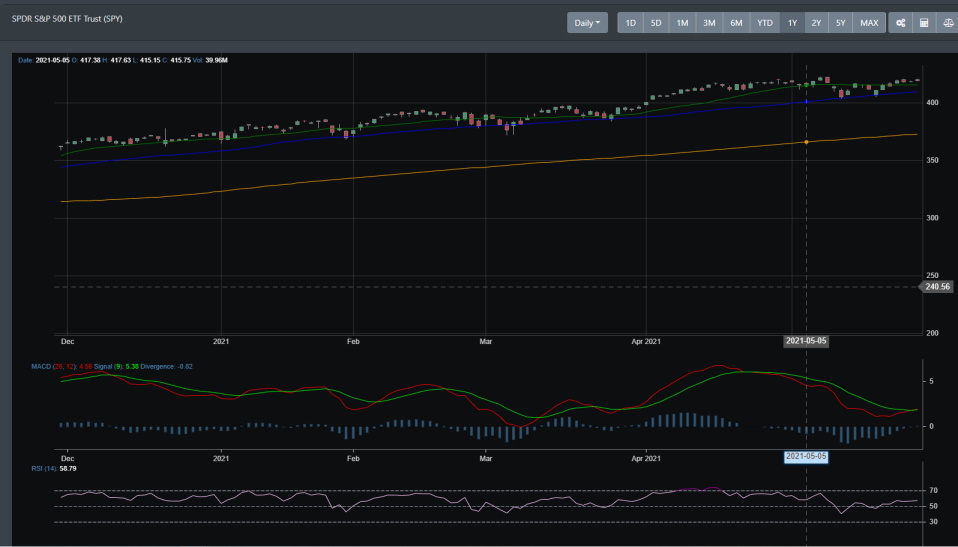
SPY traded in a narrow range this week. SPY trended lower during mid-week but gapped up on Friday to close near all-time highs. The technical readings on the weekly and daily charts are very bullish.
QQQ
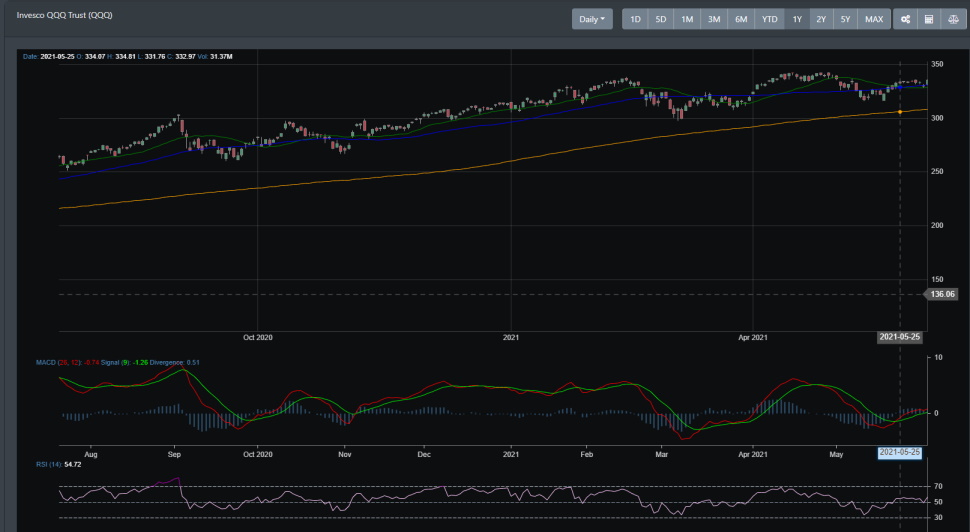
QQQ was trending sideways for most of the week. Only until Friday did it move up almost 2%.
IWM
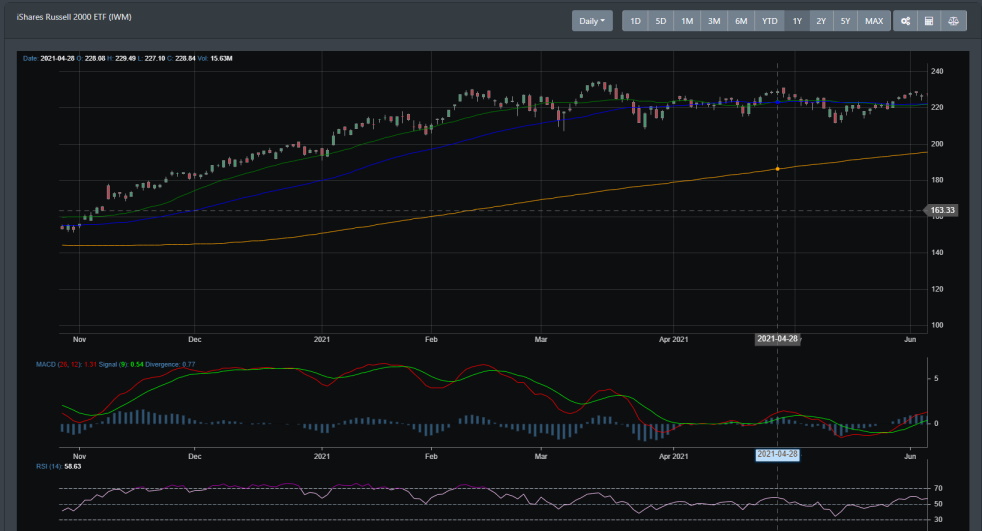
IWM was strong early in the week and had a sell-off on Thursday. Like QQQ, it had a strong rebound on Friday.
Concluding
Markets are starting to creep upward to test the old highs. The S&P 500 tried this week but found support near the 4110 region. This is good news for the bulls as the market continues to hover near all-time highs. With market breadth indicating strong momentum underway, we expect to see a summer rally come this June with the push to 4300+ this summer. The short and intermediate technical readings are in a bullish pattern and BullGap's buy signals have been triggered.