


For the past 2 weeks, it has been a tale of two tapes. The financial market rebounded from having one of its worst weeks of the year (since February) to delivering one of the best performances for the year (since February). The S&P 500 rallied by more than 2.8%, the Dow surged +3.3% and small-caps and mid-caps ran away with +4.1%. Nasdaq posted 4 all-time highs this week alone! S&P 500 added to its all-time-high.
So much has been made of recent inflation that has pundits calling for a 10% market correction. News pundits calling on Fed easing of QE also has put fear into the market. One thing is clear. These opinions have been immediately stomped by the current raging bull market. As we have discussed in several of our previous blogs this year, markets have been consolidating for much of Q2 due to the large rally that took place after the March 20 lows. If you were in the camp that viewed the Fed ready to raise rates to curtail inflation, then you would have been sitting on the sidelines as the market tact on another high this week.
Strength begets strength and the market right now is moving higher to our projected target that we discussed in last week's blog.
Big Picture
All major indices started the week strong with the Russell 2000 leading the charge by posting +2.0% on Monday. S&P, Dow 30, and Nasdaq all rallied on Monday as well. Right into Thursday, most of the indices flatline while the Nasdaq caught wind and posted 4 new highs for the week. The S&P gather strength later on the week and posted back-to-back highs to end the week.
Again, if you were one who was on the camp that the market was ready to tumble from last week's dip, then you would have been quite frustrated at this point. In fact, if you were hedging on the short-term breakdown then you may have lost more than just your gains from last week.
The overall market is still in a major bull market. The uptrend is still intact. Any hedging against the primary trend on negative news or "gut-feeling" can lead to a disastrous portfolio.
Market Breadth Table
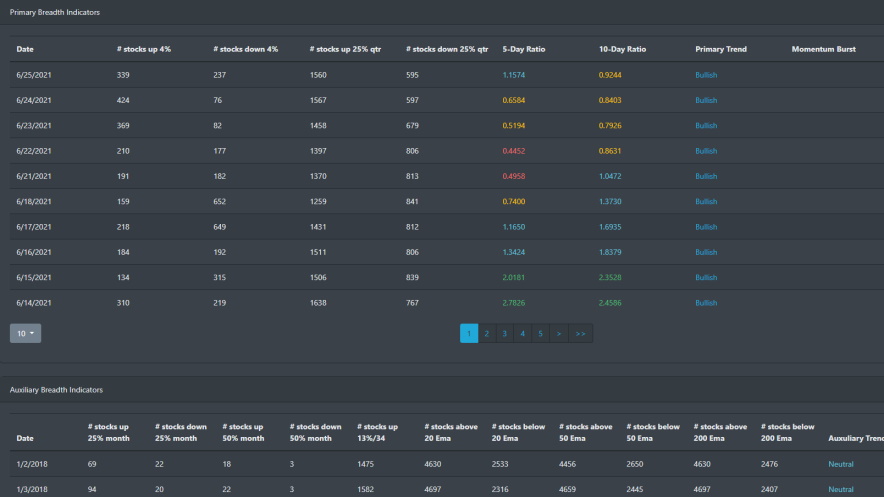
Last week we can see markets slowly wind down from the momentum burst signal that occurred in late May. However, the 5-day to 10-day ratio has just triggered the bullish side signaling more the rally is still ready to move the upside. Market breadth is still showing strength with a solid percentage of stocks in their 20 EMA, 50 EMA, and 200 EMA. In fact, this has been the case for the majority of the year.
Market Sentiment
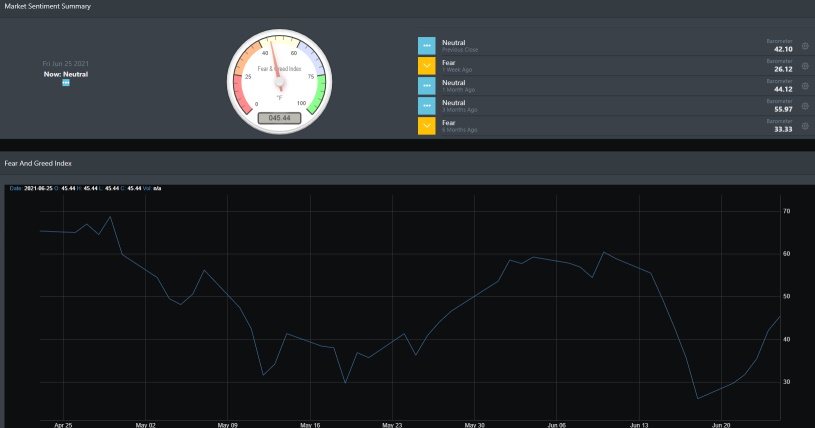
Since dropping to one of the lowest readings for the year in mid-June, bullishness is making its way back into the market. BullGap's market sentiment index was reading a low of 26.12 in mid-June and under a 2-week timespan it has moved up to 45.44. It is this exuberance in the market that is carrying the current push to new highs.
Economic Outlook
The U.S economy is currently in an expansion phase. According to the IHS Markit Flash U.S. Composite Index, expansion was highest in May where it posted 68.7. The private sector is having a historical expansion at this point in the year. Due to delivery delays, however, pricing pressure was elevated (inflation). This speaks to the current inflation and how the Fed views this as only be transitory due to the nature of the supply chain.
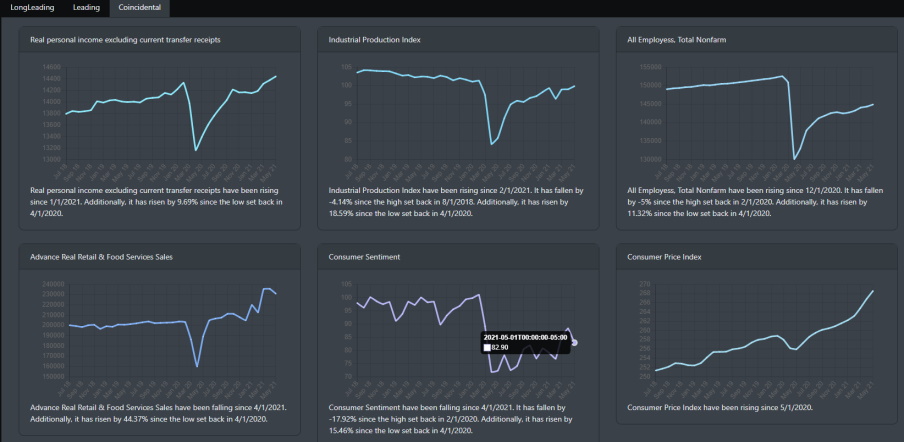
Personal income is trending higher and above pre-pandemic levels. Industrial production is still trending higher as well. Consumer sentiment dropped to 82.90 in May but is currently reading 85.5 this month.
Market Outlook
It has been a strong week for the bulls. SPY and IWM are pushing higher and QQQ made a new high this week. It looks like a slow grind higher for the summer of 2021.
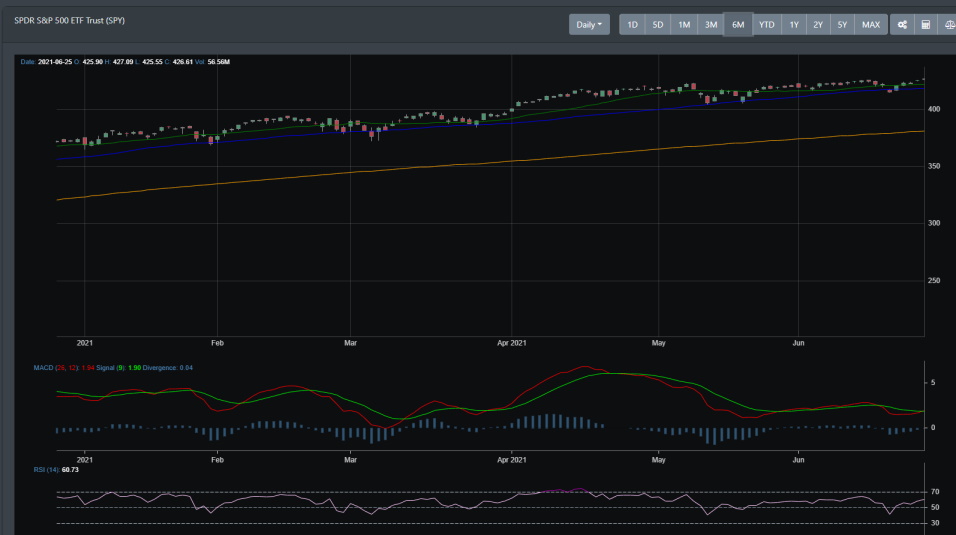
SPY
SPY wrapped up above its 25-DMA and 50-DMA support line. The weekly and daily technical readings are currently bullish and all signs point to the index moving higher.
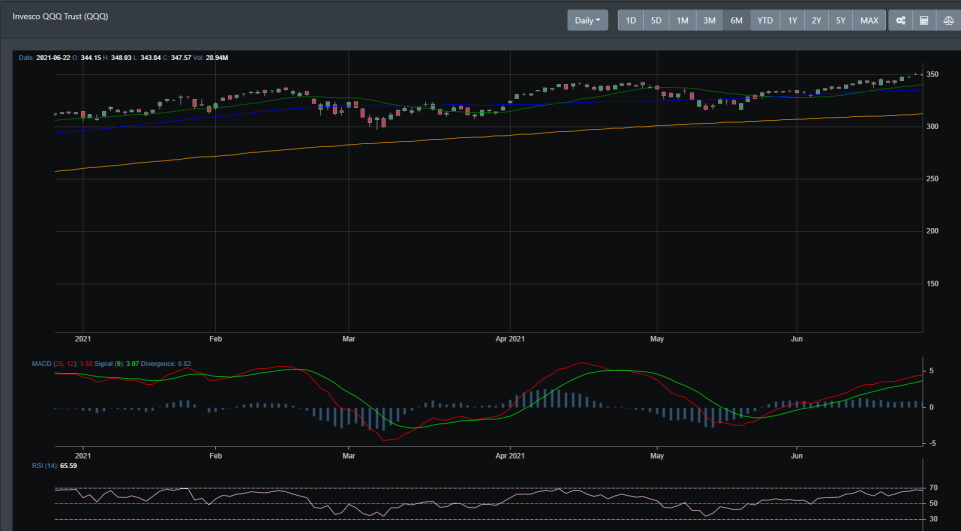
QQQ
Since late May, QQQ has been pushing higher and is now in a strong uptrend. For the last couple of weeks, it has broken new highs and the weekly and daily technical readings are strong.
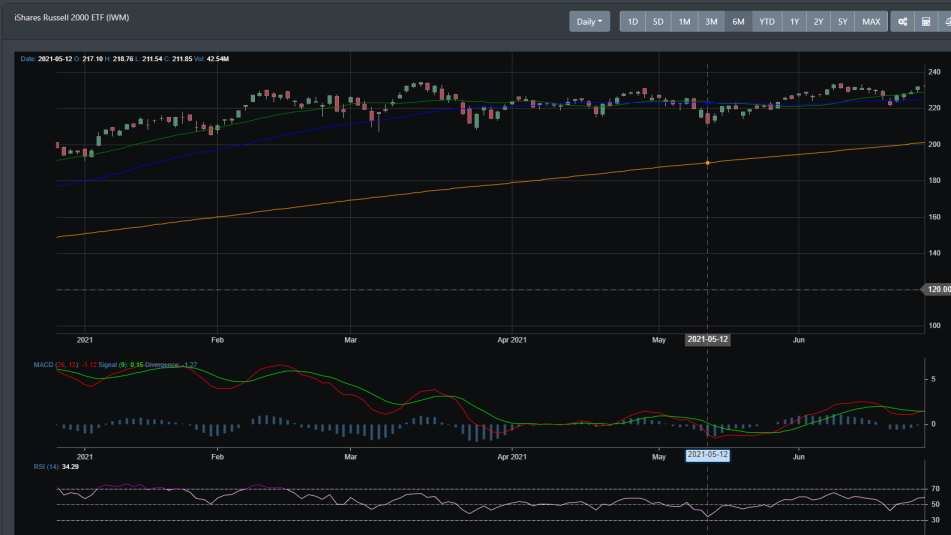
IWM
IWM has been in a consolidation pattern since February. It has yet to make a new high but the daily MACD buy signal was triggered last week.
Concluding
Economic data is positive and BullGap's recession index is at an all-time low. With the economic expansion underway and re-opening still occurring, we expect there to be some hiccups along the way. Ex. Inflation due to the supply chain from the re-opening.
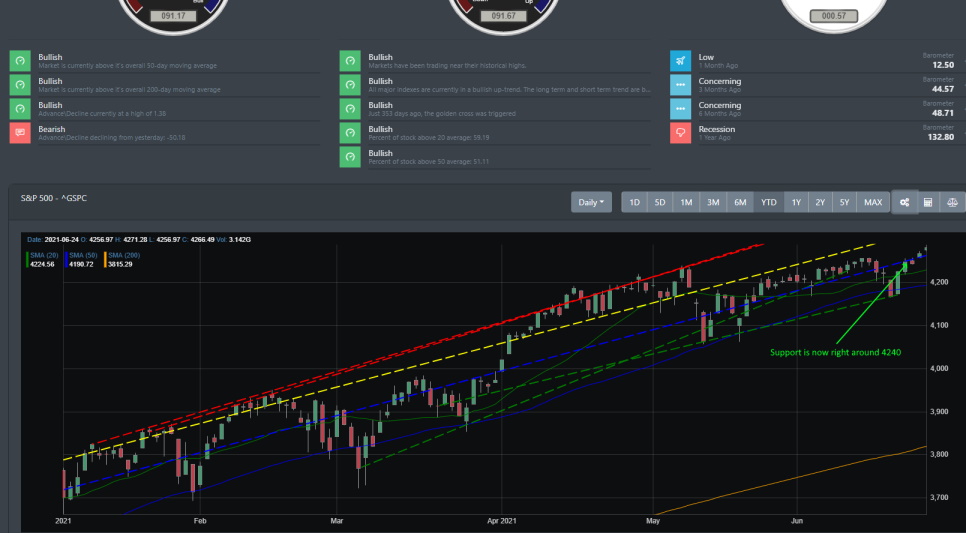
The primary uptrend is still intact. The S&P 500 made a new high and close at 4280 for the week. As we mentioned in our December 20 blog, we believe the market would push to 4300 in 2021. This is likely to occur this summer. The S&P 500 is right now at the 4240 support area and as long as this support holds in the next coming week, we believe the next target is around 4350. It is possible that once the S&P 500 breaks the 4300-4350 region, we will see a minor dip. After this, we see the market rallying higher to end the year.
If you are an investor that is following advice from market pundits and analyst who are calling for a market top and +10% correction, then chances are you are losing out on this Bull market rally. Market data is reading strength right now and has been that way for most of the year. Do not be left behind.