


Something interesting happened in the bond markets this week.
There is a well-known mantra in wall street that states "Don't fight the Feds." Every hawkish policy decision the Fed has deployed this year has seen rates go higher while long-duration bonds move lower. This week, the bond market called the Fed's bluff and instead of moving to an all-time new low, the bond market went into rally mode. This is significant as the recent movement is potentially signaling a low has been struck in the bonds market.
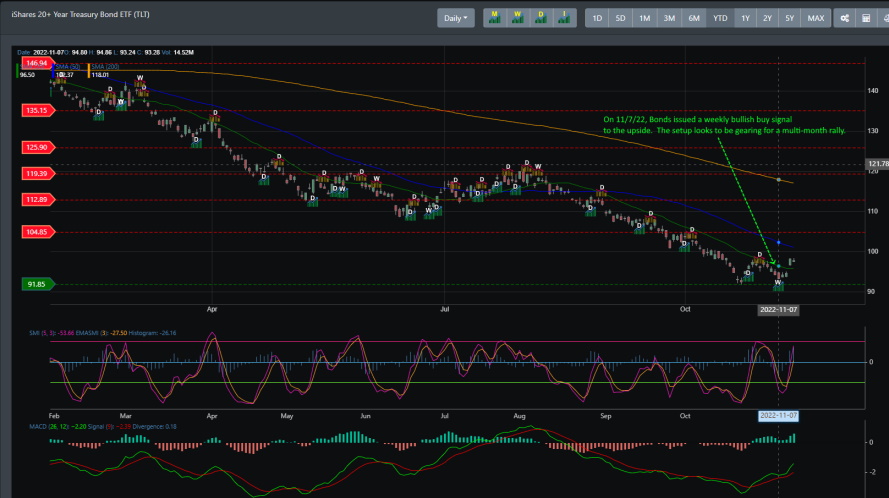
Take a look at the ETF TLT which can give a window into how bond investors view the movement of future interest rates. Even with the Fed's last hawkish stance on inflation and rate hikes, BullGap's weekly bullish buy signal for TLT was triggered on November 17. While weekly momentum is still in the negative, it has turned upward. This signal is suggesting that bonds are catching a long-term bid which will ultimately mean rates will move lower.
Big Picture
Since we last blogged about it in October, the rally has continued. As discussed in our last blog, Dawn of a new bull rally, we concluded with the following remark:
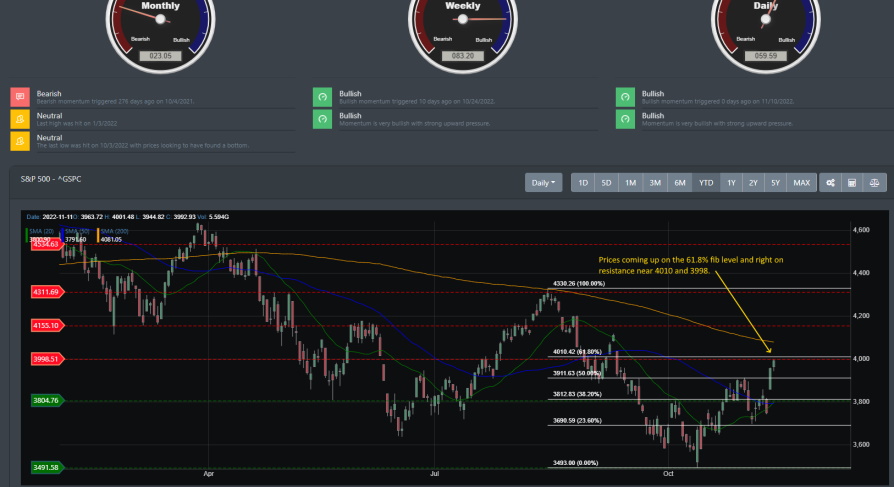
With the bullish technical setup in place, the current rally looks to have more momentum to push higher. However, up next is a test for which the bulls failed to push higher back on August 16. That comes around the 3998 to 4010 region and this scenario sets up the bull for a re-test of the 200 DMA. But before we get there, with the recent daily readings at near-oversold, there should be an expected pullback in the very near term. If the bulls are going to really challenge the bears, then prices need to stay around the 3800 region. And as long as prices consolidate on this support and the rally continues, there is a good chance the next target is the re-test of the 200 DMA.
Two weeks ago on our last blog, the S&P 500 closed out the week right at resistance on the 50 Fibonacci level. As expected, we saw a pullback the following week. As with any rally, resistance is a key area where upward price movement gets tested. The pullback fell well below our expected target and landed near the 23.6% Fibonacci retracement level. It then rallied back up to close right at 3992.93, less than 6 points of what we suggested in our last blog.
Market Breadth
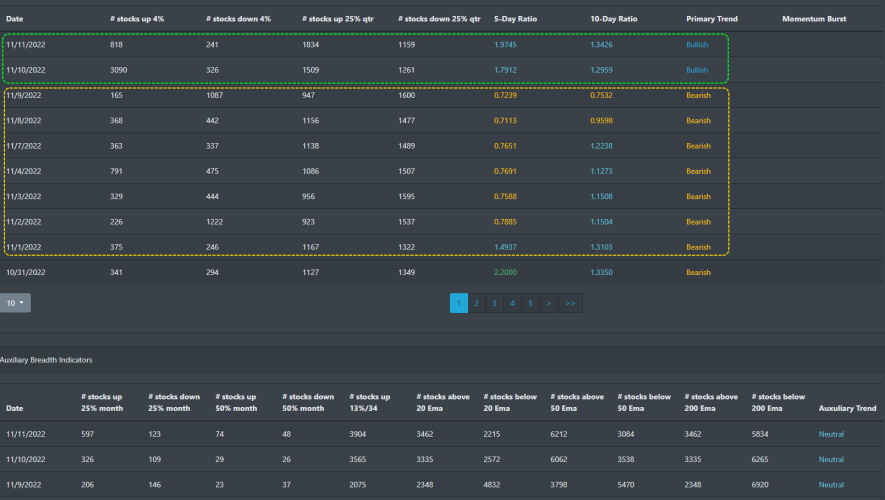
In the near term, market breadth internals have turned bullish. There was a point leading up to the final week of October where the data was suggesting a cross-over was immediate. That did not happen due to the early November pullback but did occur this week on November 10f. That bullish crossover can be seen in the primary trend in the table below. The auxiliary data points also are seeing improvements in the percentage of stocks up on their respective trendlines. For example, the stocks above their 200 EMA have not moved to this level since the last significant rally of July 2022.
Market Sentiment
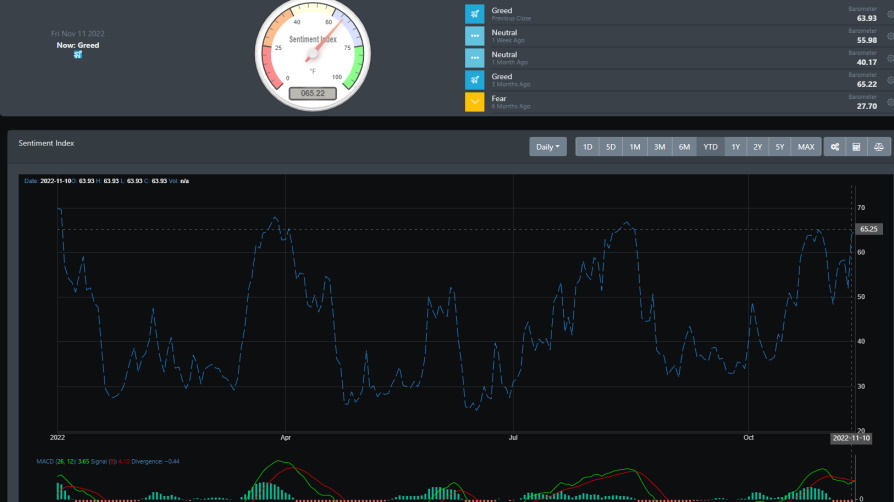
Market sentiment is in greed mode! Since our last blog, the MACD reading and other technical readings were suggesting a topping out. The current reading today points to more upside and continued greed reading in the overall investor sentiment. However, keep in mind that daily sentiment readings at this level never are sustainable and there is always a reversion to the mean.
Market Outlook
As we have been discussing since last month, the larger technical time frames for all major indices are now aligned on the bullish side. With several key divergences and the weekly timeframe turning bullish, markets have rallied higher from the mid-October lows. Let's take a look at the indices from the weekly timeframe.
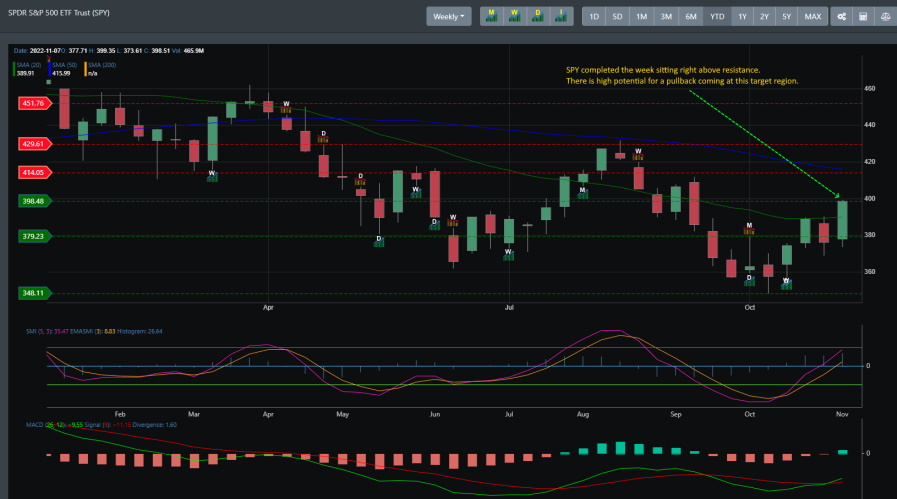
SPY
Since triggering a weekly bullish buy signal on October 17, SPY has been in a strong uptrend. As in all rallies, we expect profit-taking and minor pullbacks with a counter-trend to break through resistance. SPY has done just that for the past 4 weeks. It has broken through the 380 region and now it is challenging the 398 to 400 region. Notice that this week, the weekly MACD has triggered the bullish side. Other technical readings also suggest there is a high potential for more upside.
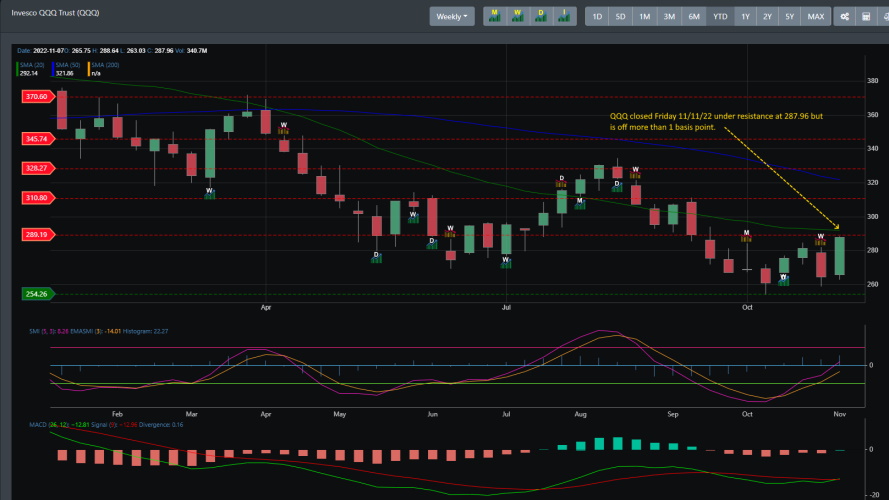
QQQ
Unlike SPY, QQQ recently triggered a bearish weekly sell signal on October 31. Since QQQ tracks the Nasdaq 100 Index, it has been affected by the Fed hike rates for the year. However, technically speaking, the MACD did close the week on the bullish side. Additionally, with recent news on the CPI report, QQQ has the potential to move higher.
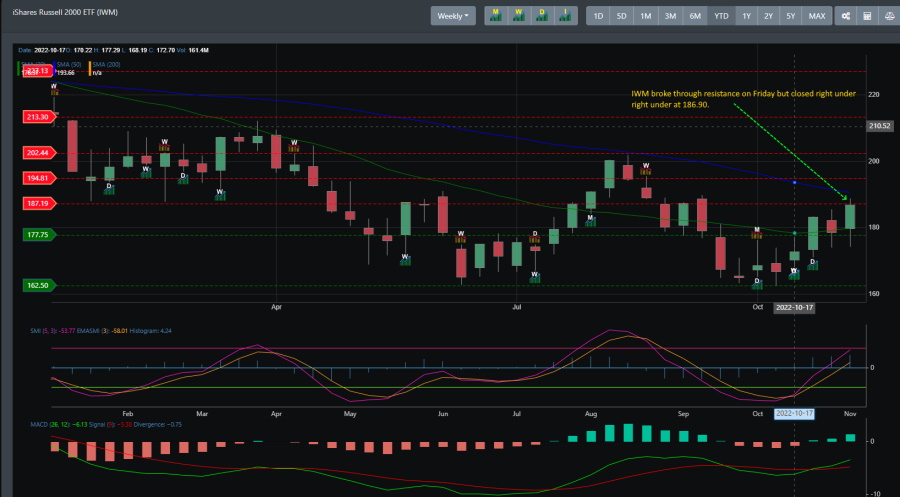
IWM
As we have stated many times, small caps can be used as a strong leading indicator for predicting market direction. While other major indices such as SPY and QQQ were still setting new lows, IWM had already bottomed in September and has been rallying since early October.
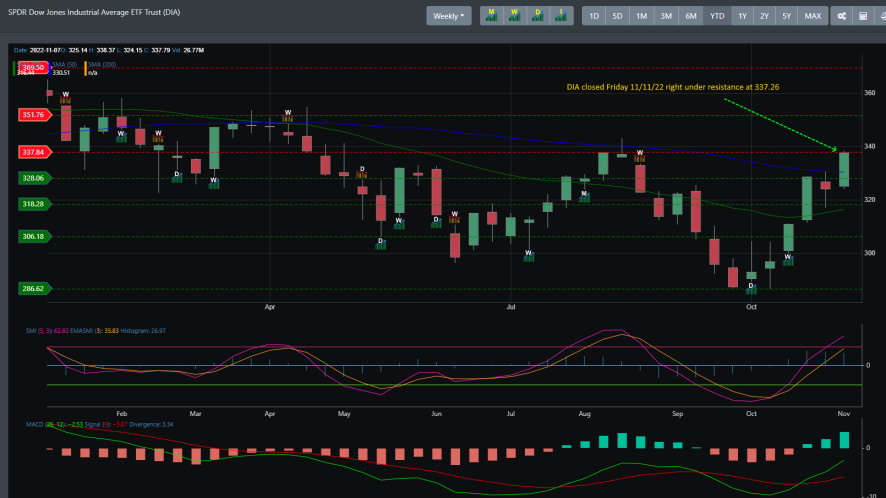
DIA
The often ignored DOW Jones DIA ETF has been the winning ETF for October. Like IWM, it also bottomed in late September, only to rally to break through several key resistances and reclaim its 200 DMA. Unlike all the other indices, DIA is the only one where the monthly bullish signal has been triggered.
Concluding
With the Consumer Price Index (CPI) report coming out on Thursday, the bears were annihilated in pre-trading hours. The decline in the CPI report fell for the 4th consecutive month in a row (annualized basis of 8.2% to 7.7%). Declines were also reported at the core rate level along with prices for airline fares, used vehicles, etc. How does this impact stocks potentially? A lower rate of inflation may have the Feds reduce or end their rate hike campaign. If this occurs, this could set up a strong tailwind for the markets and bring in the Santa rally by end of the year.
Technically speaking, markets are now aligned and poised to push higher. All major indices closed the week right near their respective resistance. If the next pullback can hold support and turn higher, we can potentially see markets pushing into new highs in the coming year. At the current moment, IWM and DIA are looking to lead the markets higher.