


What a difference a few weeks have made since the last blog on 7/16/22. Up to that point, the S&P500 was down more than 20% and the economy was looking into the barrel of a recession. However, from a technical perspective, we mentioned that there were strong signs that the market had the potential for turning the corner.
The last blog stated "From a technical perspective, all major indices are near a strong buy signal. With technicals being in highly oversold territory and larger time frame signals poised for a push to the upside, there is a potential for a change in market direction for the bulls". Additionally, we made note that IWM (small-caps) was already signaling a bullish buy. "Now, with a weekly buy signal that was triggered on 7/5/2022 and the weekly MACD ready to cross over, it looks like IWM could be signaling a change to the overall market to the upside."
Since that post on 7/16/22, the S&P 500 entered this week rallying +12% from the June lows while the Nasdaq posted +16% since the June lows to start this week off. The S&P 500, Nasdaq, and Russell 2000 have made it three consecutive weeks of positive gains.
Big Picture
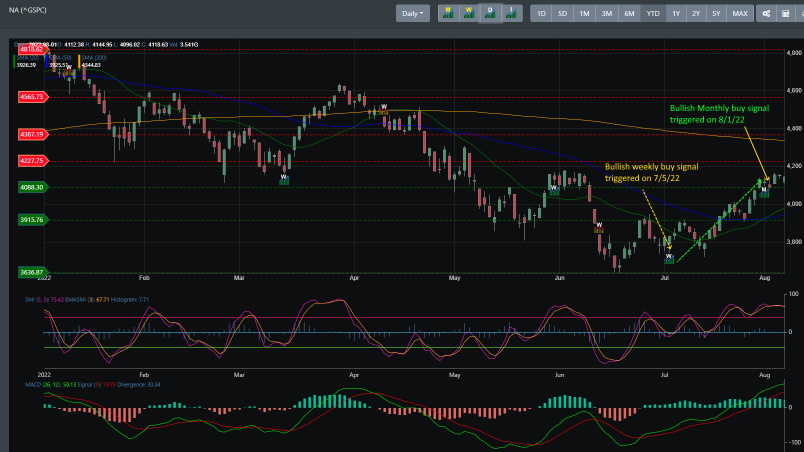
Since hitting the lows in June and receiving the weekly buy signal on 7/5/22, the S&P 500 has rallied more than 13% to close out the week. 7/19 was its first test of resistance at the 3915 region. It pushed through and consolidate that week before heading higher to blow through the 4088 resistance line. That week also triggered the monthly buy signal which indicates a change in the overall market direction. Right now, it looks like markets are consolidating right on support near the 4088 support region. The technical conditions are now in overbought territory with the MACD and Stochastic topping out.
Market Breadth
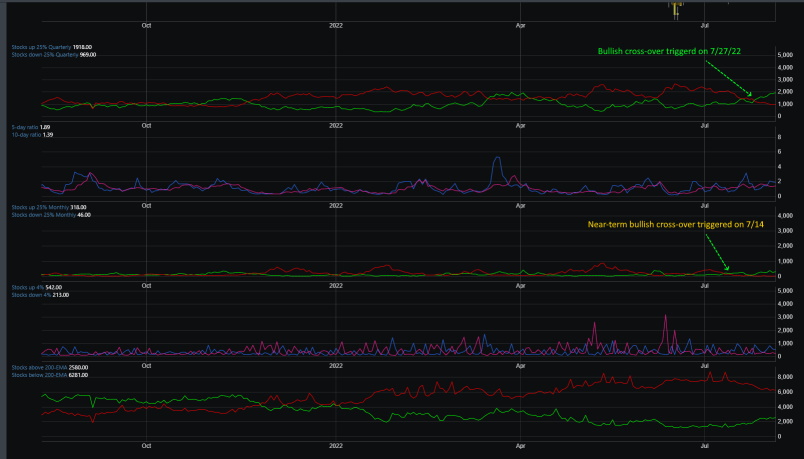
For the first half of this year, we have been pointing out how dreadful market breadth has been on the market. In fact, market breadth has turned bearish since hitting 11/17/21. Looking at the breadth data below, we have the first clear sign of a change in trend direction toward the bullish side. On 7/27/22, the primary trend changed to bullish.
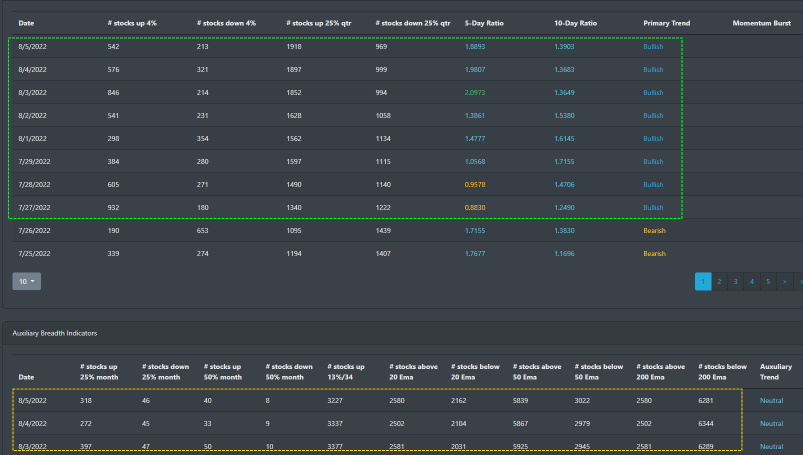
Though market breadth data still has a long way to go in addressing the overall weakness in the bullish market trend, you can see that near-term market internals is improving. The stocks that are above\below their 200 EMA is also improving.
Market Sentiment
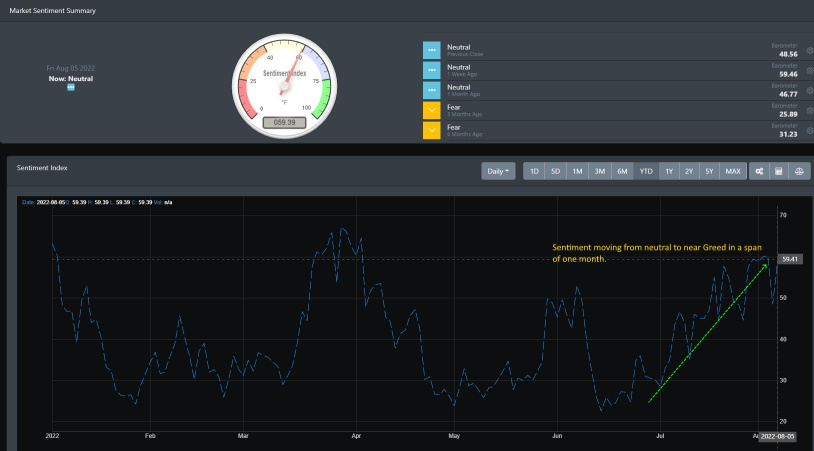
The S&P is continuing its rally higher this correlates with where sentiment is currently being placed. With July in the books, investor sentiment has improved to where this week the indicator reached right up to the greed level at near 60. While technicals are reading overbought, FOMO is almost here to keep sentiment at these levels.
Market Outlook
Ths week the monthly buy signal was triggered for all major indices. The index ETFs such as SPY, QQQ, and IWM is now showing a change in market direction to the bullish side. When the weekly buy signal triggered in early July, it was hard to tell if this was a starting point for a larger time frame to move to the positive side. It took the rally of July to push markets into a new bullish trend. Now whether this trend continues higher is dependent on a number of factors. For now, let's take a look at the daily charts to see what they tell us.
SPY
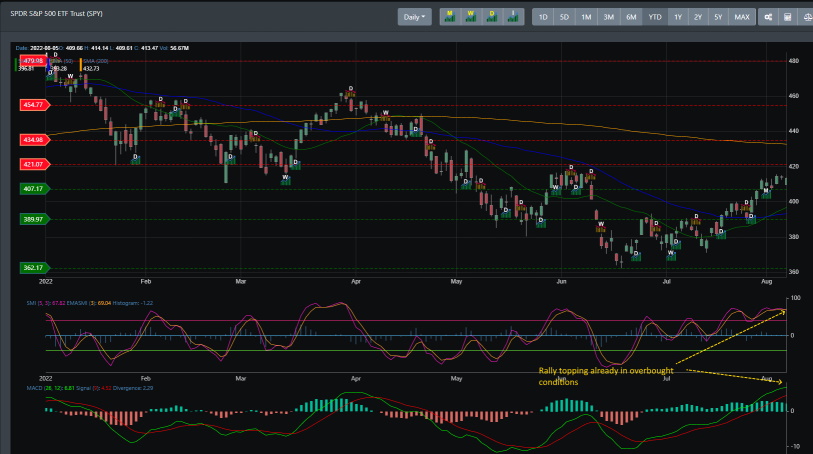
SPY has rallied off the June lows to where it now sits right above its current resistance of 407. Though the technical readings are in overbought territory, a monthly buy signal coupled with FOMO almost ready to kick in could suggest that SPY has the potential to challenge the 421 resistance region in the coming weeks. A breakthrough 407 could have SPY retesting its last support at 389.
QQQ
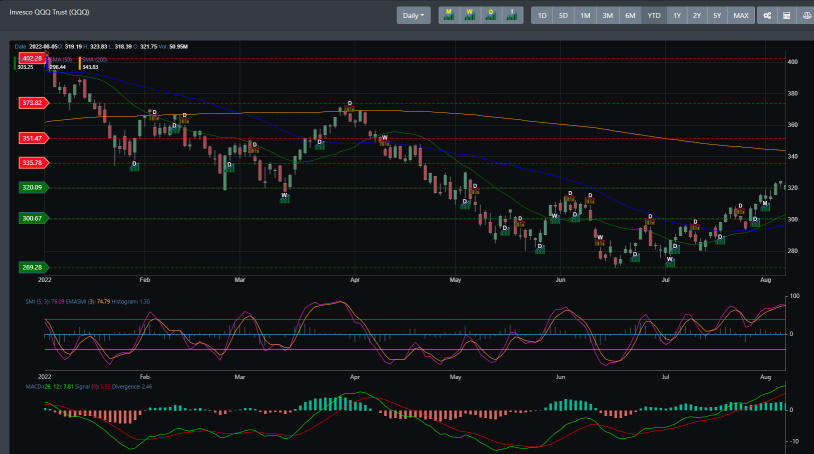
Like SPY, QQQ is also in the same predicament where it has rallied off its June low and now it is consolidating right at support near the 320 region. The technical readings suggest that it could be topping out in the near term and if it does it could be looking at a test of the 300 support region.
IWM
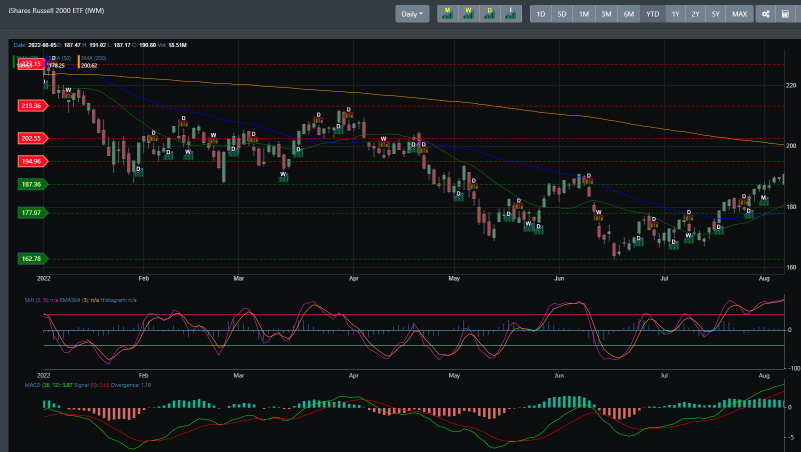
IWM is still rallying strong and though its intraday readings are showing bearish, the daily readings are suggesting more upside. It is currently consolidating near support at 187 with the next resistance being at 194.
Concluding
The summer rally has helped push the market direction into bullish territory. With recession fears and the Feds trying to figure out if they will raise rates by 75 points in September, there are some items on the table still left to be determined. However, the technical readings are saying that the markets have already changed their tune and are looking for a bullish 2nd half of the year. But in the near term, markets are now in overbought territory and technical readings are indicating a topping is nearly in place. The pullback will test support at near the 4088 region. If support cannot hold, the next stop will be at the 3915 support line.