


Jerome Powell came out this week and confirm what the Fed has been suggesting for a few months now. The central bank's plan is to begin tapering off the easy money supply by reducing the number of bonds it will buy (120 billion in monthly bond purchases). This of course means opening the books to raising interest rates as the US economy continues to improves.
While the Feds were indicating a tapering that will start occurring in the near term, markets continue to make their ascent to all-time highs. Just imagine that only earlier this year that there were many market pundits calling for markets to heavily correct on news of Fed tapering. Well, just this week, markets shrugged off the news and marched to new highs. So much for the experts calling for another big correction.
For this week, the S&P 500 gained +1.5%, Nasdaq hit over +2.8% and the Russell 2000 bounced off key support to gain 2.85% for the week (its biggest gain since mid-July).
Big Picture
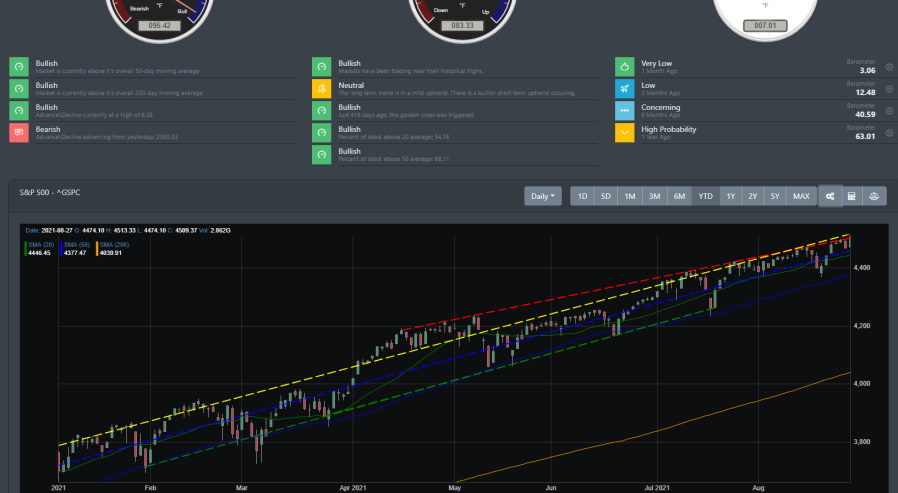
Market participants were full "risk-on" as FOMO was in high gear this week. The S&P 500 closed the week at 4509 and by all looks technically, it is setting up for a potential melt up to the resistance line at 4548 to 4600. The Nasdaq pushed up past 15000 for the first time this week and the Russell 2000 bounced off key support to push +2.5% for the week. Anyone that tried to call toppings or hedge the market found themselves on the negative side of profitability.
The S&P 500 has just broken through to the resistance and is aiming at the 4500 to 4600 line now.
Market Breadth Table
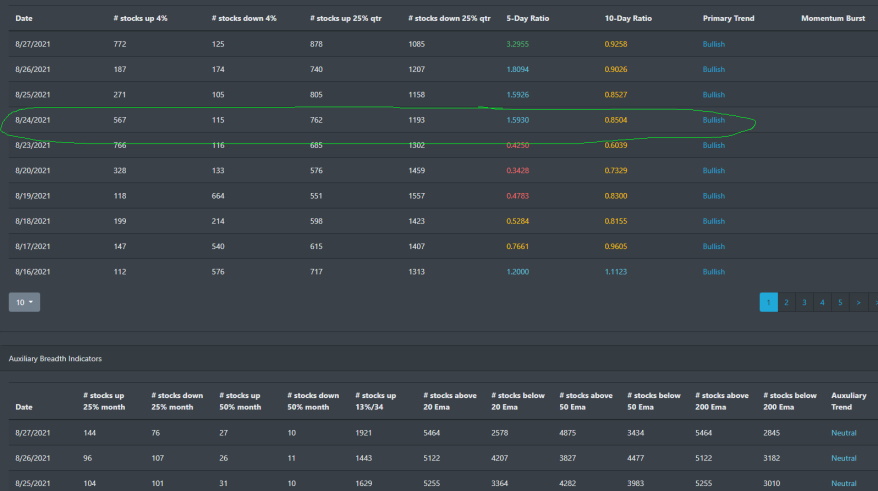
As we discussed last week in our blog, there was some concern in the market breadth reading that suggests a dip was coming soon. But as we now see below, markets on Tuesday turned bullish and closeout Friday with the 5-day ratio now in the green.
Market Breadth Chart
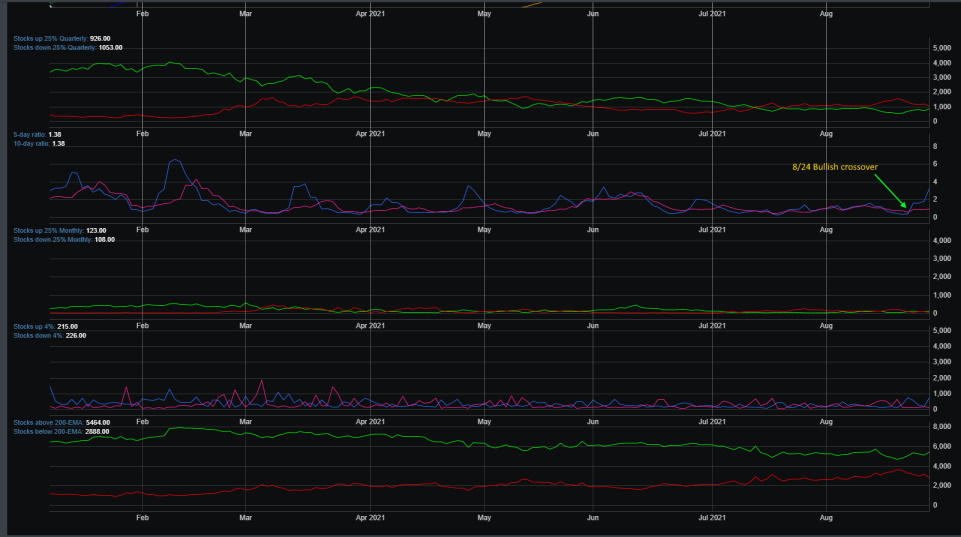
Market breadth was oscillating in bearish reading for most of July and August. On August 24, there was a strong push by market participants to propel the 5-day to 10-day ratio bullish crossover. If this momentum continues, stocks up 25% to 25% down are looking to crossover as well. Also, notice that stocks above their 200 EMA pushed higher as well.
Market Sentiment
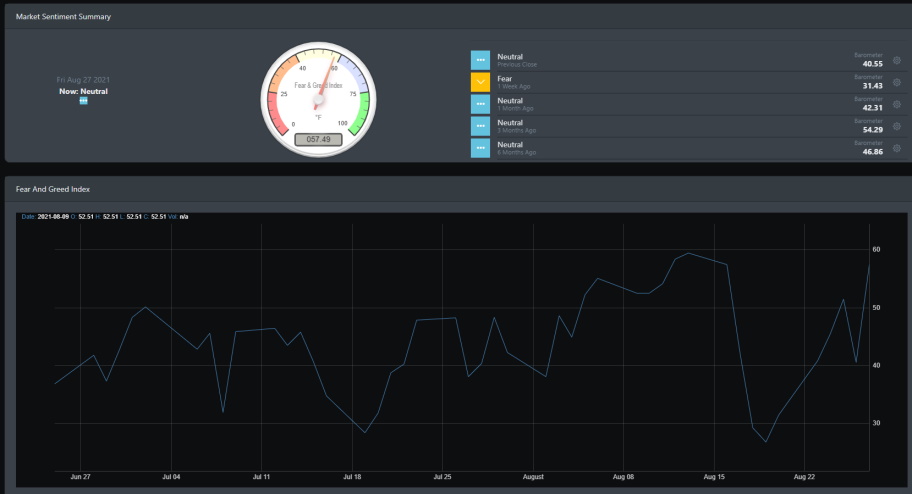
After hitting a low of 26.77 on August 18, BullGap's market sentiment index skyrocketed to close out Friday at 57.49. It only took one week for the indicator to go from Fear to almost bullish. The last time the index hit over 57 was back on April 26. Historically, when the sentiment index hits about 55 to 60+, it typically sees a dip in the coming weeks.
Economic Outlook
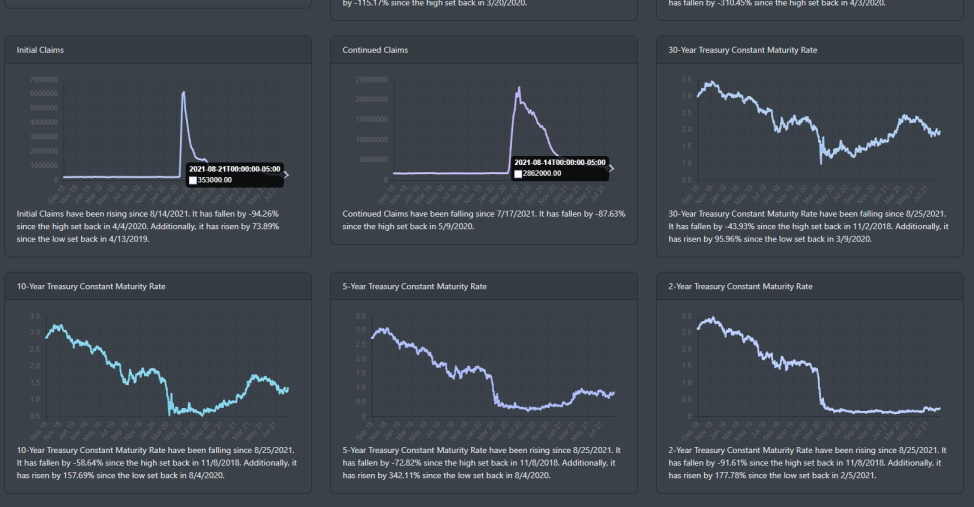
As we discussed this year in our prior blogs, the economic backdrop is positive. Last year's recession was self-induced due to COVID-19. The global economic shutdown decimated the labor market for much of last year and this year. JOLT reports that the number of job openings is at a high of over 10 million. In recent months, hiring has increased and though the long-term unemployment data remains elevated, there is an indication that the labor market is improving.
Initial claims did have a small uptick to total out at 353K but it has been trending lower since its high of over 6 million back in April 2020. The continued claim continues to trend lower.
Market Outlook
It was a strength across the board this week. With most sectors in the green. Energy had the biggest performance as it was up +4.8%. Financials and consumer discretionary also had a positive with +2.7%.
Let's look at the market from the intermediate chart. Technically speaking, the weekly charts for major indices are in overbought conditions. That said, that is in a confirmed rally.
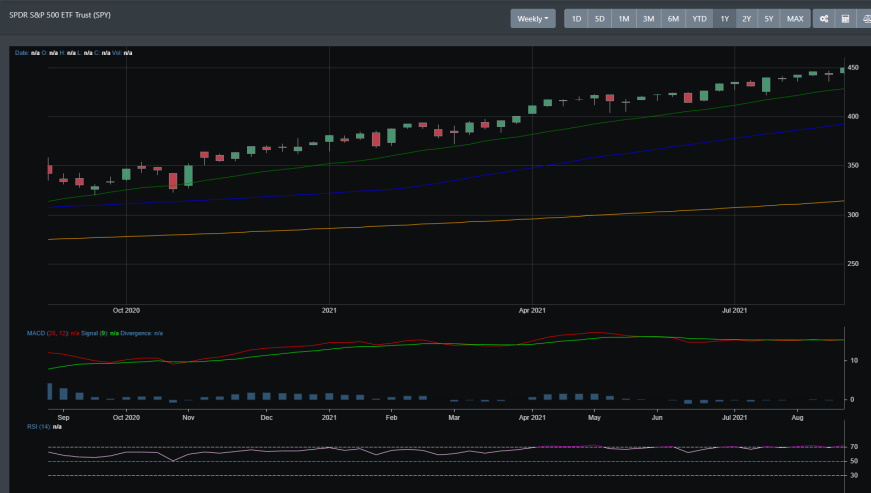
SPY
SPY has been a solid performer for all of 2021. It is well above its 20, 50, and 200 DMA support line. Though the technical readings suggest SPY is overbought on the weekly chart, SPY has plenty of room to run.
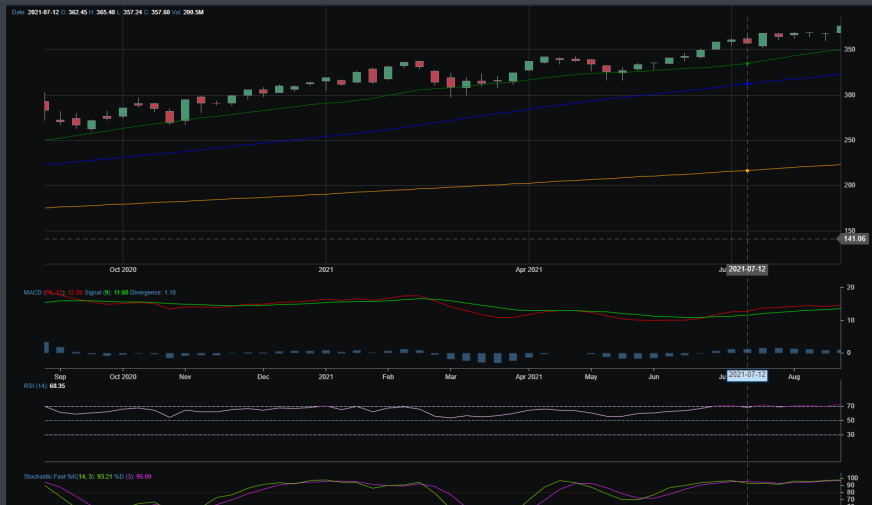
QQQ
QQQ has the same technical reading as SPY. It did test its 20 DMA this year but it is clearly in a strong uptrend.
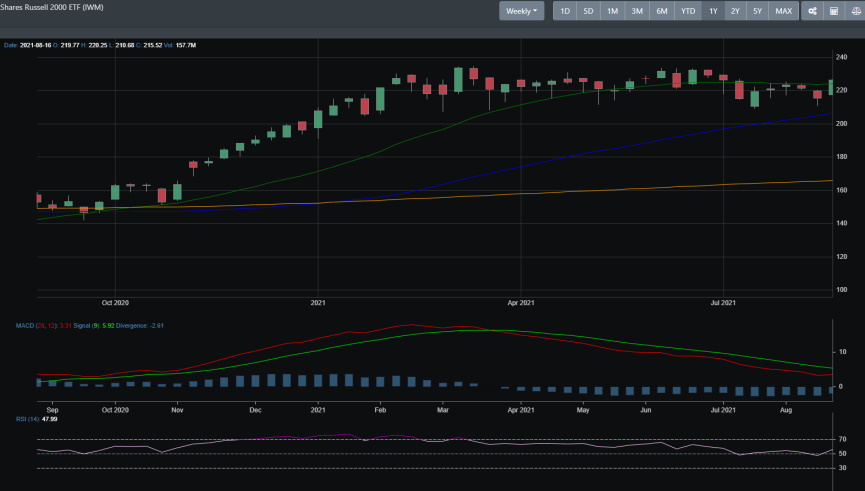
IWM
IWM has been consolidating for the most part of the year. This week it tested support at the 50 DMA and bounced to move higher. It has yet to break out of key resistance and is trading between the 210 to 230 levels.
Concluding
There have been calls upon calls from market pundits and market gurus of an impending market correction. Anyone on that side of the camp has been thoroughly wrong as markets have been making all-time highs for all of 2021. The overall trend is bullish and this bull market rally still has room to run. With the economic data being strong and the market in a strong uptrend, any market correction or dip will be a good buying opportunity.