


August is finally in the books and all major indexes were in the green. The S&P 500 ended August with +2.5% while Nasdaq was the winner with a solid +4% gain. DIJA also rose +1.2% while IWM rebounded to post a positive gain of +2.1%. Even with nonfarm payrolls missing the consensus estimate of +700,000 jobs for August, markets closed the week with risk-off euphoria. For the past few months, we have been hearing a lot of noise regarding inflation, delta variant concerns, and the labor supply conundrum that should have tanked the market. Yet, here we are again this week discussing how investors have had the luxury of having 8 consecutive months of positive gains for the S&P 500.
Big Picture
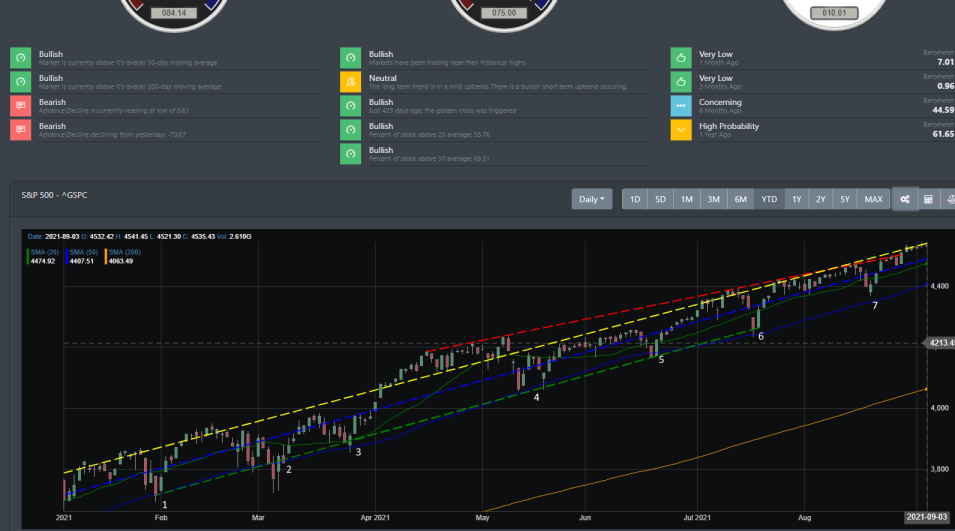
Back in December 2020, we discussed in our blog how we saw a setup for 2021 as a year where the market will have a melt-up. With the current technicals presented to us at the time, we expected the S&P 500 to have a strong rally to close out 2021 near the 4600 line. Well, we are not even in the 4th quarter of 2021 and the S&P 500 is poised to do just that. At the time, the market was near 3600 and there were many news outlets and market pundits calling for a market bubble that was about to burst to send the S&P 500 into a +10% correction. That has yet to materialize.
Looking at the chart below, we outlined 7 specific "dips" for the year. We have outlined this behavior before in our prior blogs but it is important to emphasize its importance. Since November 2020, market dips have been shallow and quick. The last 7 pullbacks played out technically with each dip testing the 50 DMA line and our average trend line. Each time the market tested the 50DMA, FOMO kicked in high gear and the dip buyers were out in full force.
If you did not read a single financial news report regarding inflation worries, labor market disruption, COVID variants, you would be hard-pressed to see how any of the news affected this bull rally.
Market Breadth Table
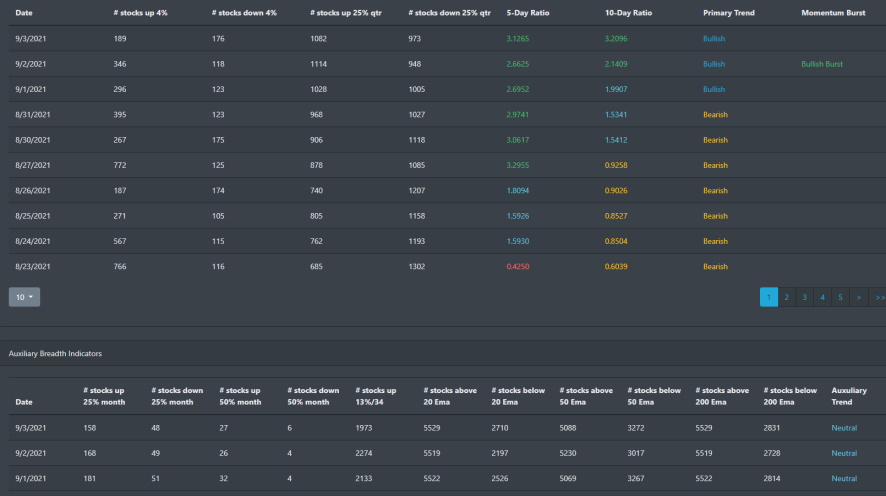
Market breadth is turning bullish with a recent burst signal trigged this week. Market breadth from mid-July and up to mid-August was looking bearish. It was only until late August did the overall structure of market breadth start to trend in a positive direction. The number of stocks above the 20, 50, and 200 EMA are trending higher but below their highs back in early February.
Market Breadth Chart
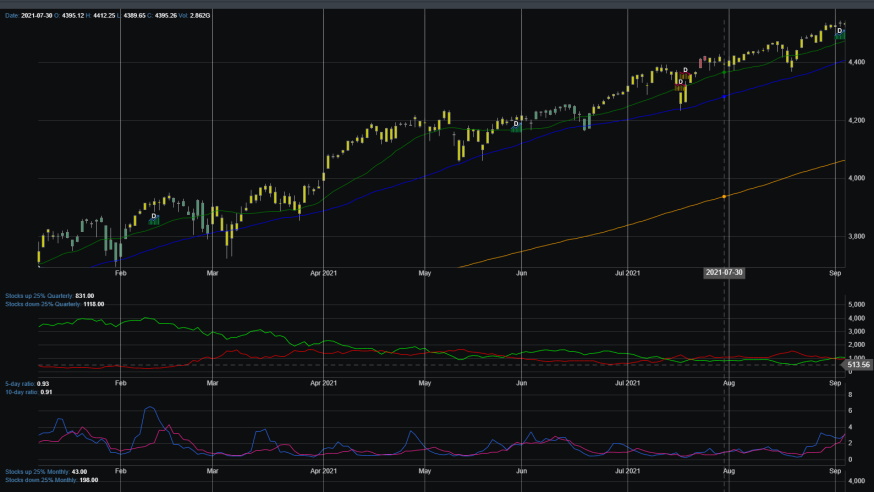
The last couple of market breadth burst signals did serve as guidance that markets would head higher. However, if we look at the last 2 signals, they were immediately followed by a short-lived dip in the market. Right now the % of stocks above 25% has crossed over to the bullish side indicating there is potential for more upside to the market.
Market Sentiment
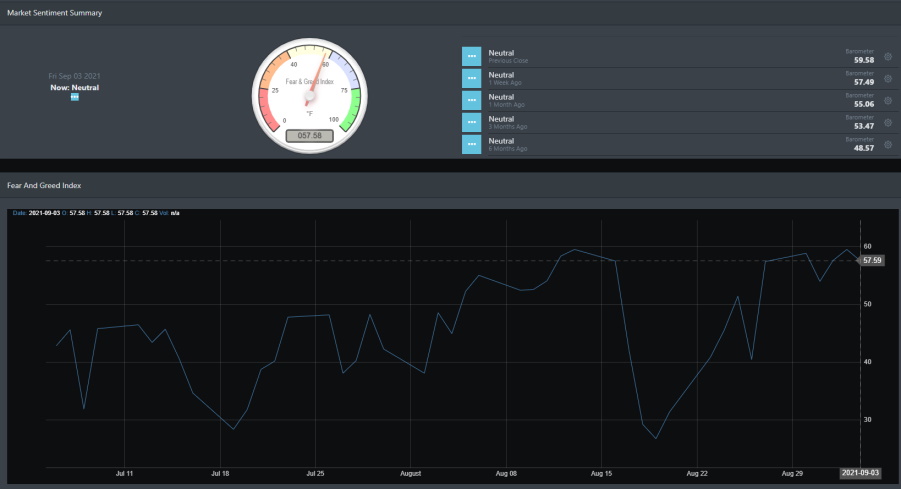
Market sentiment for this week has been pushing near the greed level. It closed on Friday at 57.58 but pushing to a high of 59.58 on Thursday. That is the highest reading since the last highest reading back in late April where it posted a reading of 64.46. Historically, when BullGap's market sentiment indicator hits a level at or above 55, there is a dip in sentiment which typically indicates a dip in the market. That happened in late April as well as it occurred recently in mid-August.
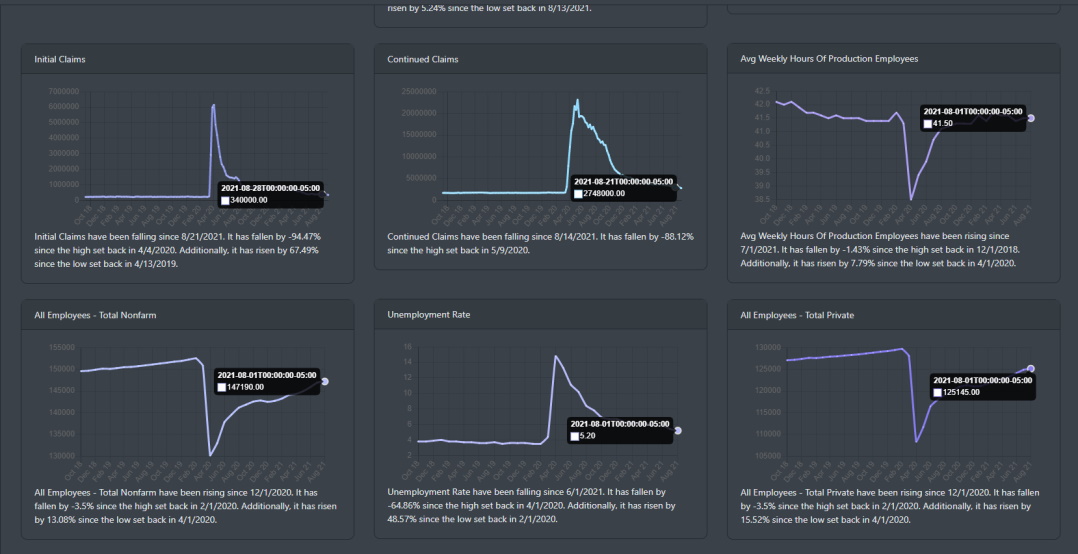
Economic Outlook
Jobless claims continue to trend lower with the seasonally adjusted initial claims coming in at 340,000. That is a decrease of 14K from the prior revised week. Look at the chart below for initial claims, this is the lowest level reading since back in March 2020. Across the board, continued claims and the unemployment rate are trending lower. However, the August Manufacturing PMI report, suggests that the global supply chain is still in limbo. Asian factories are operating at 50 to 80 percent capacity and there are extended lead times due to port delays.
The Feds are keeping a watchful eye on the labor market in hopes that they will be able to start QE tapering\raise rates to curtail inflation.
Market Outlook
With September coming into the forefront, there is a call for a major correction to occur within the next couple of weeks. Whether this occurs or not, investors should be mindful that we are still in a bull market and the last 7 dips were bought up rather quickly by market participants. In fact, last September did see a drop in the market. Not a crash as many market pundits suggested at the time but a rather shallow 4% drop.
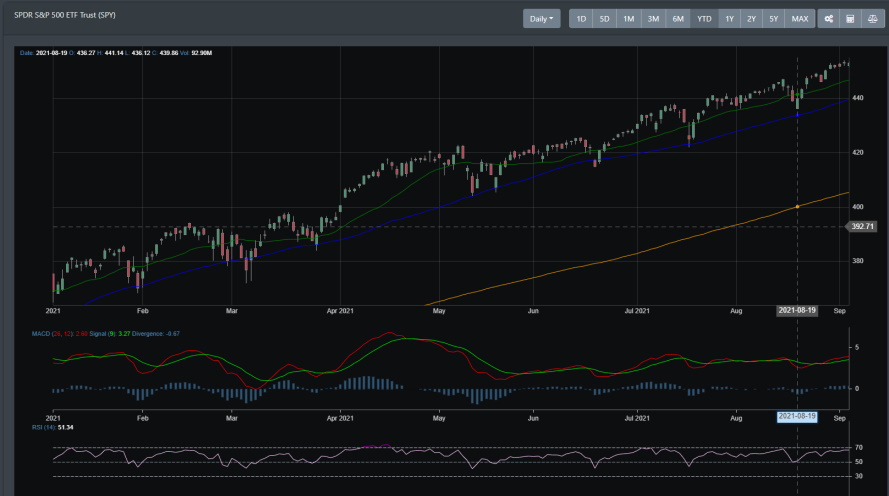
SPY
SPY is at all-time highs and the weekly and daily technical readings are quite bullish. There was intraday selling pressure on Friday but overall SPY is in a modest uptrend since bouncing testing near its 50DMA in mid-August.
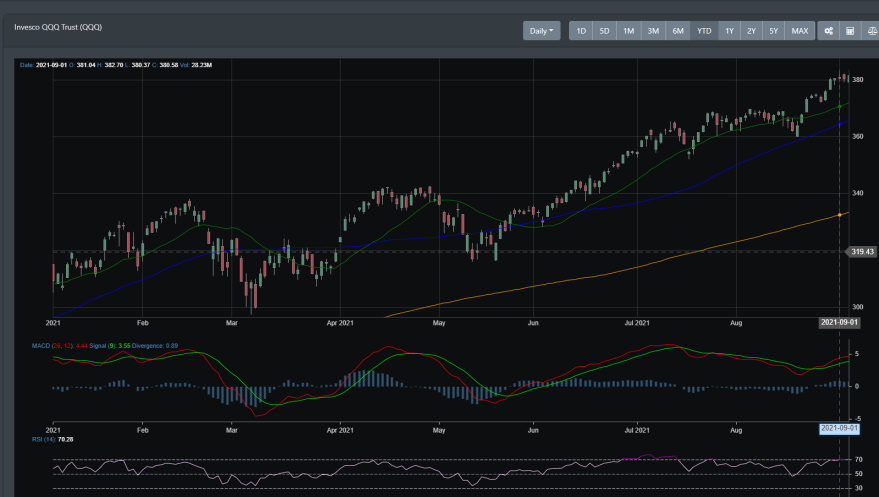
QQQ
Like SPY, QQQ is in a rally where it bounced off its 50DMA in mid-August. QQQ was consolidating during February and fell through support of its 50DMA support but has since been in a solid uptrend.
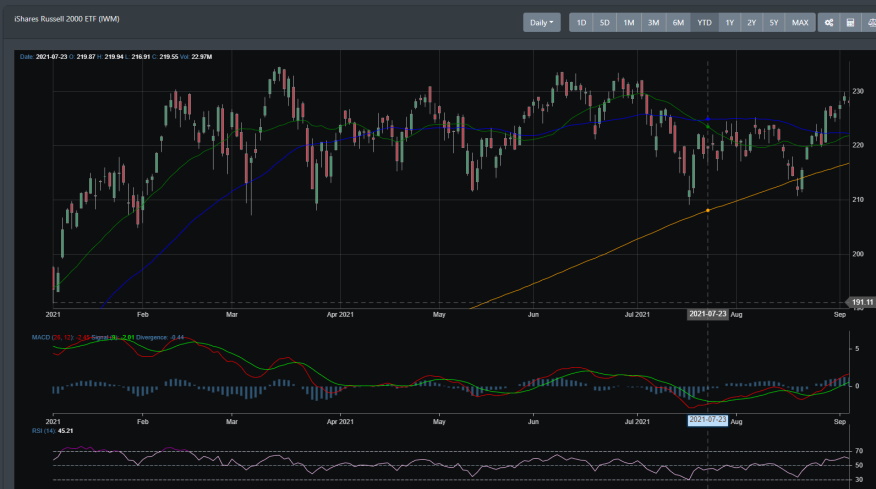
IWM
Small-caps have been consolidating for most of the year. It has been trading between 210 to 235 since February. This can be expected as IWM was one of the leading indexes in 2020. It rallied to over 145% from Sprint 2020 to early 2021. IWM also successfully tested its 200 DMA and has moved to its upper 235 trading range.
Concluding
The US equity market is currently set up technically to move higher. With September being seasonally a poor month for markets, it will be interesting to see what unfolds. The S&P 500 is gearing for a test at the 4600 line. There are news outlets already suggesting a 10% correction is looming because one has not materialized in over 9 months. Those who are suggesting that a correction is due may have forgotten the fact that back in June 2016, the markets had a 15+ month rally where it only experiences a drawdown of no more than 5%. In either case, the current technical background suggests a rally that could send the S&P 500 to near 5000 by the year ends.