


Starting in the summer of 2020, the Quantitative easing kicked into high gear with the Fed buying over 120 billion in debt securities. With the massive government stimulus package and high liquidity flooding the market, inflation reared its ugly head. Originally, the Fed attributed the rise in inflation to the supply chain (caused by the pandemic) and labor shortage but have recently changed their tune. With CPI rising by over 6% in 2021, the Fed has announced that the central bank will start QE tapering in March 2022.
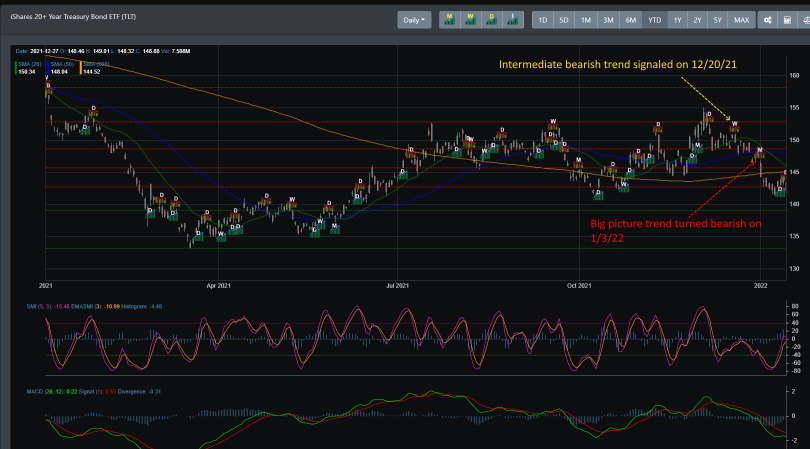
However, it was not the Fed that may have realized that the current monetary and fiscal policies are the culprit for rising inflation. In late July 2020, the bond market has been moving trending lower. Clearly showing that inflation is a standing issue in the market.
Big Picture
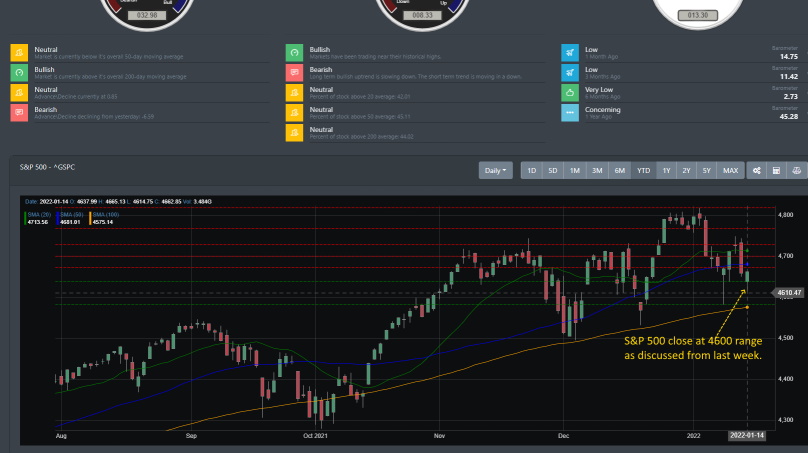
It has been a mixed week for the market with both the S&P 500 and Nasdaq eking out small gains. The Russell 2000 and Dow Jones dipped each below -.70%. As we discussed in our last blog, we expected markets to move lower and test the region around 4600 to 4650. On Friday, the S&P 500 closed around 4660. Markets right now are oversold in the near term so there is a high probability that markets push up early this week. However, if markets cannot hold the 4600 regions, it can fall down toward the 4580 support line.
Market Breadth
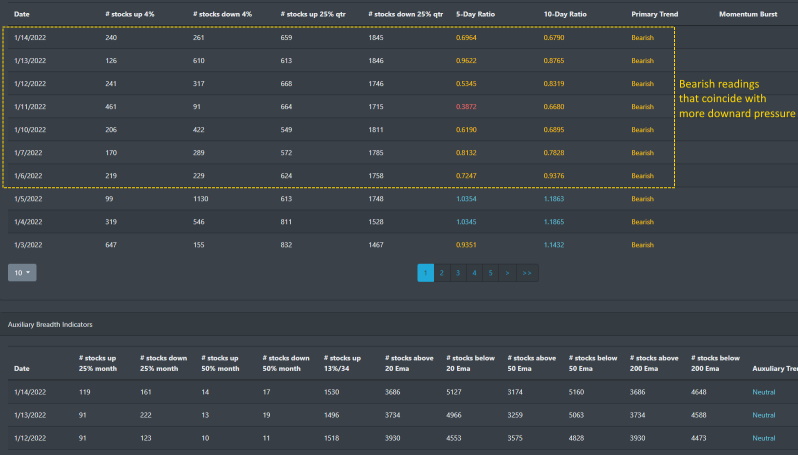
Market breadth has been bearish for much of January. The current bearish readings outline in the yellow dash below has moved from a consolidation pattern to more downward pressure on the financial markets.
Market Sentiment
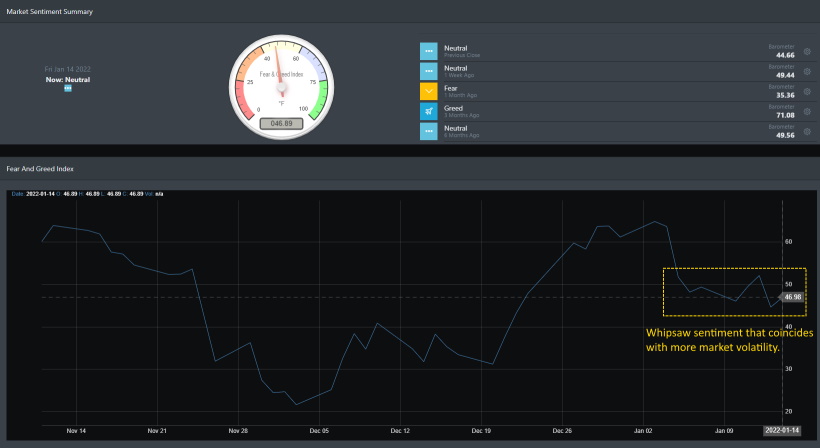
Sentiment readings have been mostly neutral for January. Since hitting the Santa rally in late December, sentiment has been more volatile as of late. This coincides with the current behavior in the financial markets as the major indices have been seeing whipsaw action for most of January.
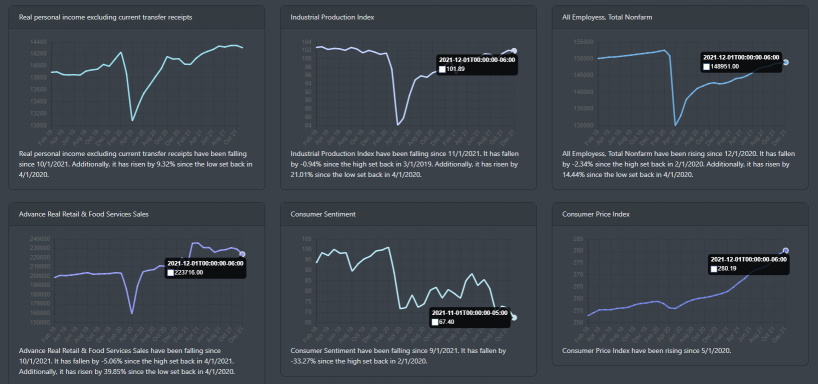
Economic Outlook
Inflation is running hot and the Fed has now taken on a stance to try to curve the progress. We can see on the chart below that consumer sentiment is hitting an all-time low and CPI has been increasing for the past year. Unfortunately, there is no indication that shows CPI has is hitting a top. Retail sales also slumped in December 2021 but overall 2021 was a positive note for retail. Industrial production also declined in December but overall has been trending higher for 2021.
Market Outlook
For the first 2 weeks of 2022, all major indices have been trending lower. Overall, SPY's overall trend is bullish. QQQ may hit a topping and IWM had a false breakout late last year and is now trending lower. Let's look at the indices using BullGap's trend signals
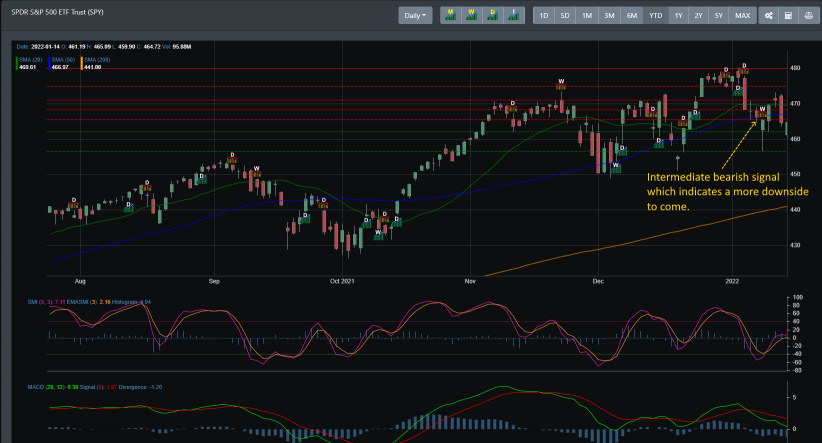
SPY
On Monday 1/10/22, SPY signal a weekly bearish signal that caused it to trend lower to close out the week. The overall bullish trend is still intact but SPY is clearly moving lower.
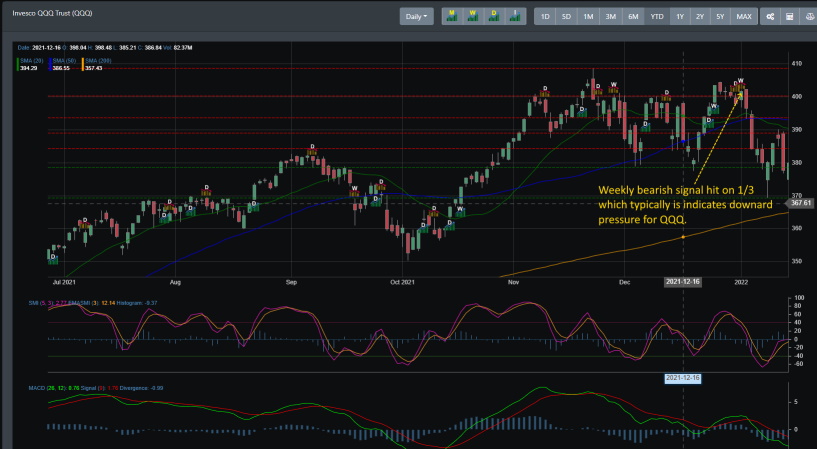
QQQ
QQQ has the look of topping out since late November 2021. On 11/29/21, QQQ signal an intermediate bearish signal and moved thereafter. It did have a counter-trend to close out the year but the recent intermediate bearish signal triggered again on 1/3/2022. Since then QQQ has been moving lower.
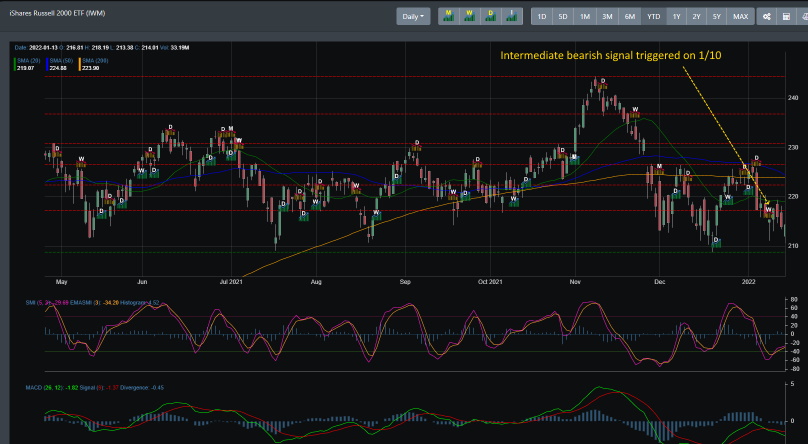
IWM
IWM had a false breakout of consolidation when its bullish intermediate signal was triggered on 10/11/21. The overall bullish trend broke on 12/1/21 with pricing now consolidating at the lower 2021 regions.
Concluding
With IWM slowing down from its 2020 rally, QQQ and SPY are just holding onto their current support. Markets have clearly capped out around the 4880 region and there is still downward pressure that will indicate that the S&P 500 may be testing its next support level soon.