BluePrint Six analyzes a company's core fundamentals and provides you with six core metrics to determine when to buy and sell a stock.
BluePrint Six
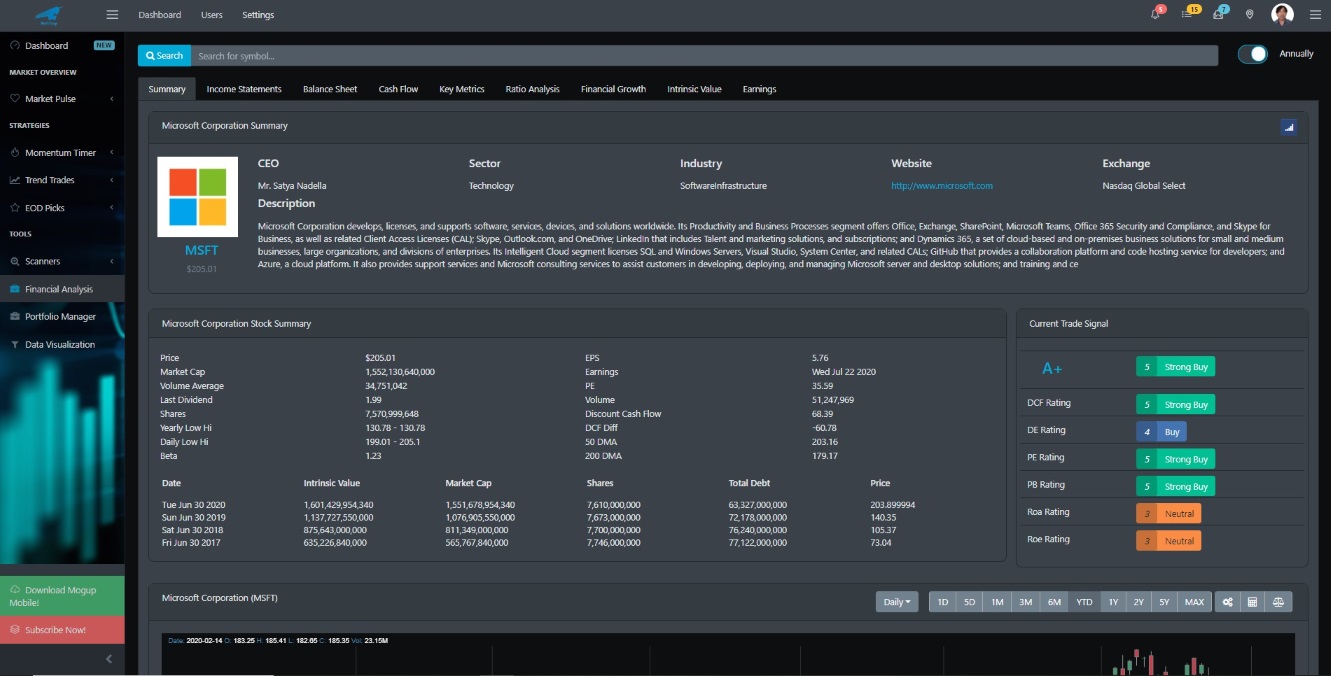
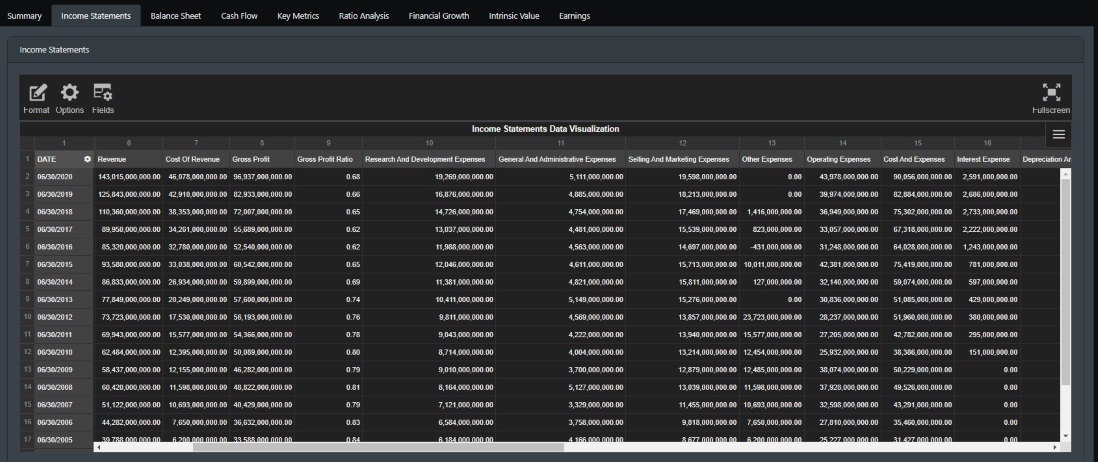
Provides you all the key metrics in one dashboard view. Here you have direct access to a company's income statements, cash flow, balance sheet, financial ratio, financial growth, earning, and computed intrinsic value.
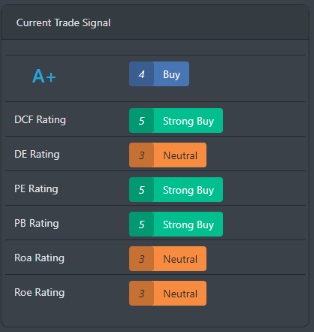
Additionally, you get a summary view of the company. At the Summary view, you get an overall profile for the company. Market, industry sector, exchange, etc. The summary view also includes the current Buy\Sell rating with the following six rating score. The overall rating score for a company is computed with the below financial models.
Six Financial Models
| Financial Model Rating | Description |
| Discounted Cash Flow (DCF) | This model projects the future cash flow and transforms them back to the present value using a weighted average of capital. |
| Debt to equity (D/E) | The model compares the total liabilities and gross debt and measures it with the intrinsic value of the company. |
| Price to Earnings (P/E) | Measuring the intrinsic value of a company by evaluating the current share price relative to its per-share-earnings (EPS). |
| Price to Book (P/B) | Calculates a rating based on a company's balance sheet, income statements, and accumulated depreciation. |
| Return on Equity (ROE) | Computes the performance over time by evaluating a company's income statements, balance sheet, etc, and the average shareholder's equity. |
| Return on Assets (ROA) | A model that factors in a company's profits to its revenue. |
Summary View dashboard
Get a quick summary profile for every tradeable company in the stock market. Also included is the stock chart for the company.
Data Exploration
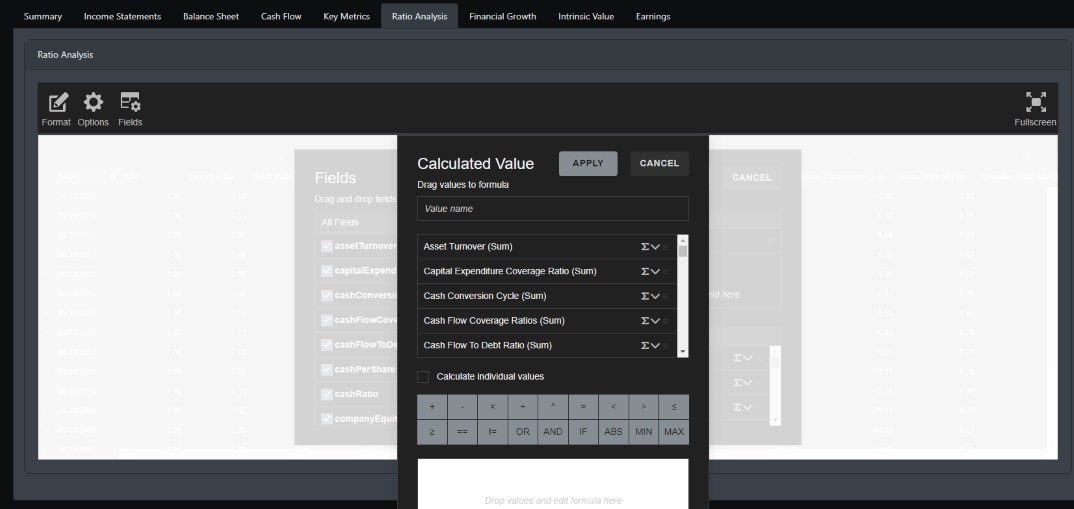
Income Statements, Balance Sheet, Cash flow, Key Metrics, Financial Ratio, Financial Growth, computed company value, and earnings are all available to you in a Pivot Table.
You can explore any part of the data. Aggregate the data, create new computations on all aspects of a company's financial data.
Highly customizable data
Group, add, aggregate all financial data to suit your needs
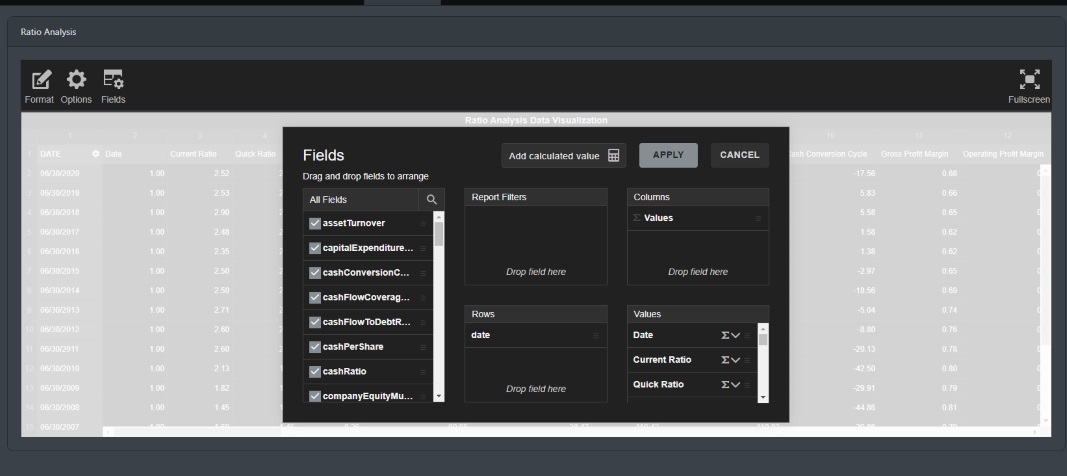
Customizable and scriptable data fields
Add your own calculated fields to find new insights.