


Two weeks ago we were looking at a strong rally that would push the bulls above heavy resistance near the 4190 region (SP500) and\or 420 region (SPY). At that time, the market was up nearly 100 points following 3 consecutive days of 75% upside. With the weekly bullish signal being issued for many major indexes, we were expecting a turn in the market to the bulls. However, that was short-lived as markets consolidated right under resistance and reversed course to the downside.
Big Picture
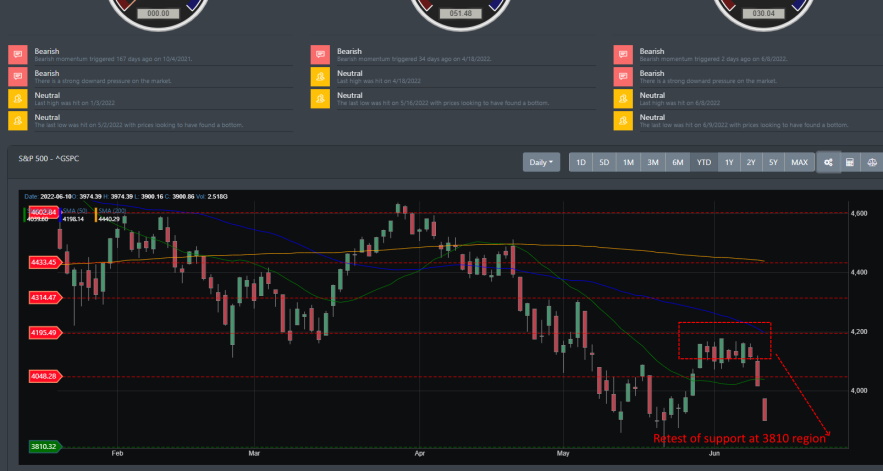
With hopes that inflation peaked a month ago, the CPI numbers that came out later in the week set up the stage for the markets to turn over. In the image below, the red box outlines where the markets were consolidating after the strong rally. With the latest CPI coming out on Friday, all major indexes took a nose dive. With the expectation that inflation has not peaked and QE tightening with rate hikes coming, markets look like they are ready to move lower and test the 3810 support line.
Momentum Market Timer
With 2022 being volatile, most 401ks are tanking and many portfolios are in the red. How has your portfolio performed in 2022? At BullGap, we have built a robust quantitative algorithm that evaluates the market from various time frames and adjusts for cycles within the market. We call this the Momentum Market Timer (MMT). Though MMT is not a predictive analysis tool like the Elliot Wave Theory, it uses discrete mathematics and quantitative analysis to run a series of computations to determine near-term market direction. It is used as a tool to trade and analyze the market. When trading, it can be used to trade the major indexes, ETF such as SPY, or leverage indexes.
There are two types of trades. Bullish trades and Bearish trades.
Bullish Trade Signals
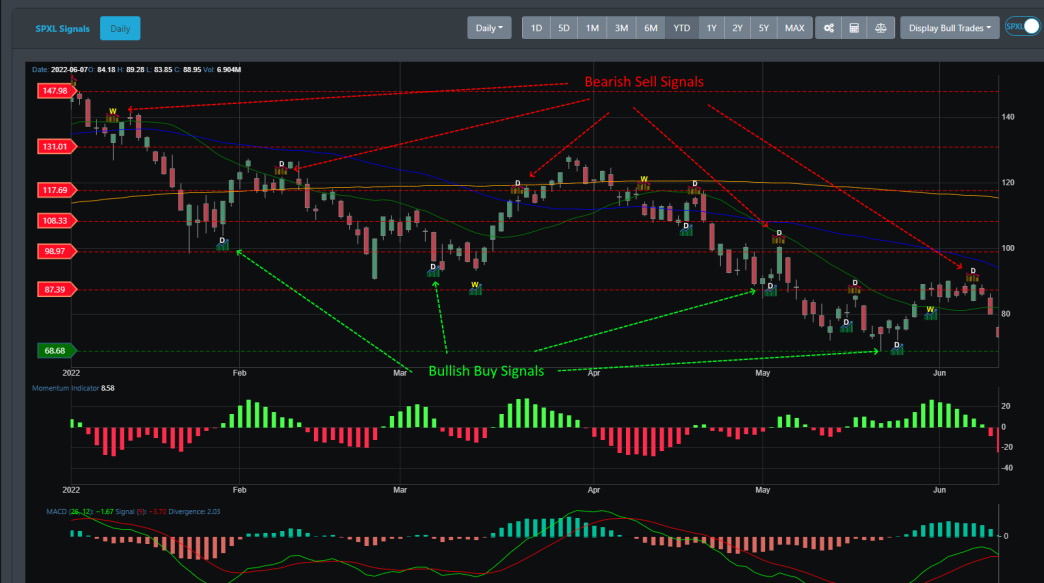
Bullish trades are triggered when MMT determines the market is poised for a rally. Below, you can see the YTD of 2022 where there were multiple signals triggered for buying and selling. The buy signals in green indicate the day and price point for which to buy. Conversely, the sell signals indicated by the red icon trigger when the market is ready for a pullback.
You can see that MMT has performed well for 2022. Of the 6 bullish buy signals triggered for 2022, only one had negative performance.
Bearish Trade Signals
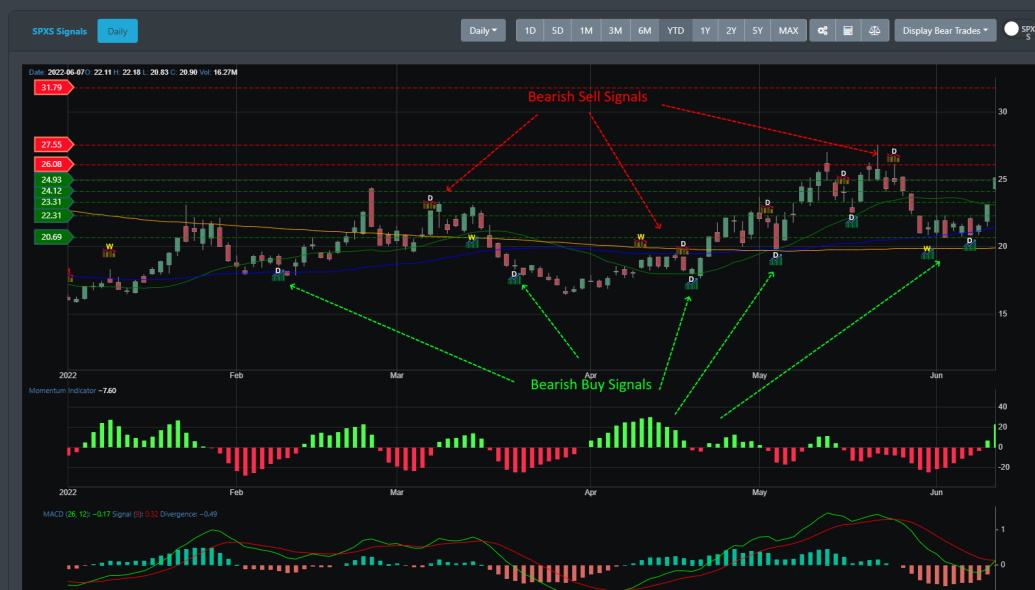
Bearish trade signals are triggered when MMT has determined that the market is ready for a dip\pullback. Below is an image of the bearish signals issued by MMT for bearish trades. When the market is ready for a dip, a bearish buy signal triggers that indicate one to short or buy an inverse ETF. Conversely, when the bearish sell signal triggers, you close out your buy signal trade. MMT bearish trade signals for 2022 have had a 100% performance record for 2022.
MMT Analysis Tool
Though the MMT was built to be used as a trading tool, it can be used to analyze the current state of the near-term market. A buy signal indicates price action is pushing markets up. A sell signal indicates markets are ready for a pullback. Below is a look at the performance
Below is a snapshot of the trade and performance of MMT. Let MMT help you navigate in today's market. Learn more about BullGap's Momentum Market Timer
2022 Momentum Market Timer Portfolio
1/28/2022 - 6/10/2022 Starting Balance: $10,000.00 USD
| Transaction Date | Symbol | Action | Price | Num Stocks | Profit | Balance |
|---|---|---|---|---|---|---|
| 1/28/2022 | SPXL | Buy | 114.58 | 4939 | 75.59 | |
| 2/8/2022 | SPXL | Sell | 121.24 | $32,893.72 USD | $598,879.94 | |
| 2/8/2022 | SPXS | Buy | 18.72 | 31991 | 8.44 | |
| 3/7/2022 | SPXS | Sell | 22.66 | $126,044.56 USD | $724,924.50 | |
| 3/7/2022 | SPXL | Buy | 96.06 | 7546 | 55.76 | |
| 3/21/2022 | SPXL | Sell | 114.47 | $138,921.89 USD | $863,846.39 | |
| 3/21/2022 | SPXS | Buy | 18.61 | 46418 | 7.38 | |
| 4/19/2022 | SPXS | Sell | 18.28 | -$15,317.94 USD | $848,528.45 | |
| 4/19/2022 | SPXL | Buy | 113.91 | 7449 | 12.83 | |
| 4/20/2022 | SPXL | Sell | 113.69 | -$1,638.79 USD | $846,889.66 | |
| 4/20/2022 | SPXS | Buy | 18.35 | 46152 | 0.44 | |
| 5/3/2022 | SPXS | Sell | 21.84 | $161,070.47 USD | $1,007,960.13 | |
| 5/3/2022 | SPXL | Buy | 92.09 | 10945 | 35.12 | |
| 5/4/2022 | SPXL | Sell | 100.43 | $91,281.34 USD | $1,099,241.47 | |
| 5/4/2022 | SPXS | Buy | 19.85 | 55377 | 8.00 | |
| 5/16/2022 | SPXS | Sell | 24.05 | $232,583.34 USD | $1,331,824.81 | |
| 5/16/2022 | SPXL | Buy | 80.59 | 16525 | 75.12 | |
| 5/17/2022 | SPXL | Sell | 85.42 | $79,815.78 USD | $1,411,640.59 | |
| 5/17/2022 | SPXS | Buy | 22.58 | 62517 | 6.74 | |
| 5/24/2022 | SPXS | Sell | 24.83 | $140,663.25 USD | $1,552,303.84 | |
| 5/24/2022 | SPXL | Buy | 76.21 | 20368 | 58.58 | |
| 6/7/2022 | SPXL | Sell | 88.95 | $259,488.28 USD | $1,811,792.12 | |
| 6/7/2022 | SPXS | Buy | 20.90 | 86688 | 12.95 |