


Another boring week is in the books and we have the equity markets pushing to all-time highs. With strong earnings wrapping up and continuing improvements in the economy, the equity market is doing what we have expected. Following the major uptrend that has been intact for the past 10+ years. Both the S&P 500 and Dow Jones wrapped up the week on new highs. The S&P 500 has recorded 3 consecutive days of new highs while the Dow posted 4 consecutive days of new highs. For the S&P 500, this marks the 47th new high for the year. Right now, it is clear the bulls are in control.
Big Picture
As we discussed last week, there has been quite a bit of news that has investors worried. As it comes to market news, there has been plenty of worries to go around for investors to digest. Inflation creeps and the COVID delta variant is just some of the recent headlines that are building a wall of worry for investors. According to the University Of Michigan August Consumer Sentiment, consumer confidence dropped from 81.4 to 70.4 for the first part of August. Many contribute this drop to a plethora of news concerning the delta variant, inflation, and labor markets. While many investors can continue to follow the camp of worry and either short or stay away from the market, the market continues to grind into more new highs. While the Nasdaq Composite ended the week down, it is only a few percent off of its recent high.
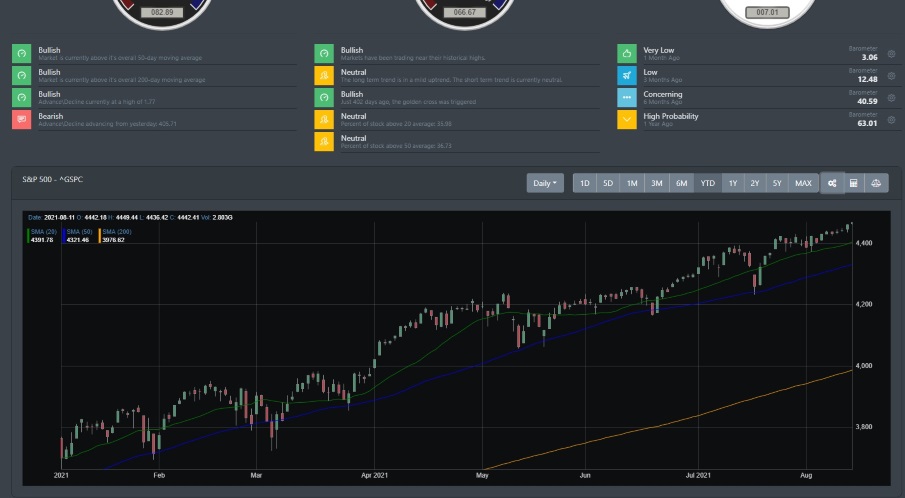
Without looking at any of the ominous news from market pundits, just take a look at the S&P 500 from the image below. This is the daily chart of the S&P 500 for 2021. Does this chart look anything like what news pundits have been stating over the first half of the year? Inflation will crash the market? Market bubble ready to correct? Delta variant will drag down the market? This looks like a market where the bulls are fully in control. Well above its 200 DMA and every dip below the 50 DMA is bought up immediately. If you are in a camp that subscribes to hedging or staying on the sidelines, you may want to reconsider your investing strategy.
Market Breadth Primary Data
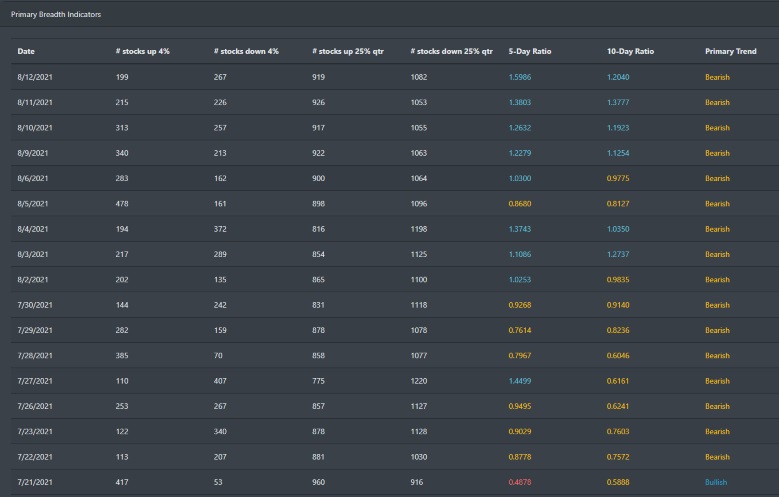
While markets are grinding higher, it is interesting to see that there are some troubling signs in the market breadth data. Since July 22, there has been a bearish reading in the overall strength of the market. One key area to look at is the 5-day to the 10-day ratio where momentum is considered bullish when the 10-day ratio is pushing above the 5-day ratio. The number of stocks up versus down is currently inverted to the bearish side. Though it is only a slight inversion, the data clearly shows that the stock universe is finding it hard to push to a more bullish stance.
Market Breadth Auxiliary Data
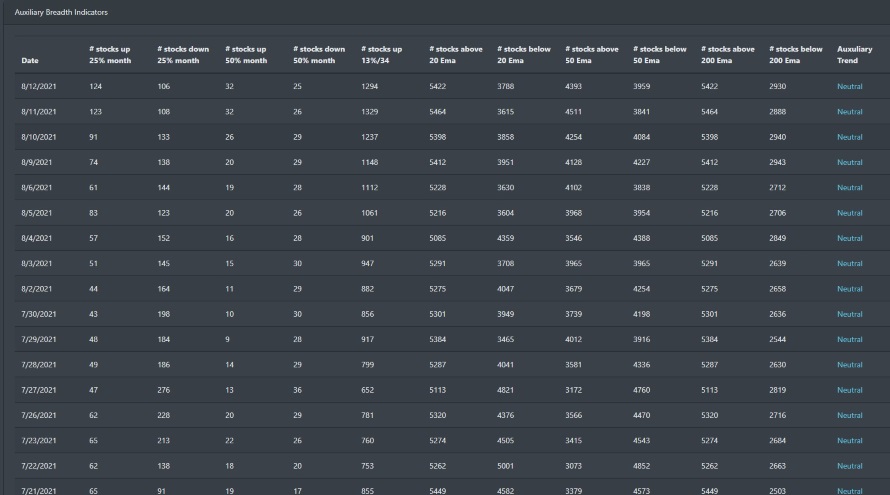
Stocks above their 20 EMA, 50 EMA, and 200 EMA are currently in a neutral stance. With stocks above their 200 EMA leveling out at around 5000 for the past few months.
Market Sentiment
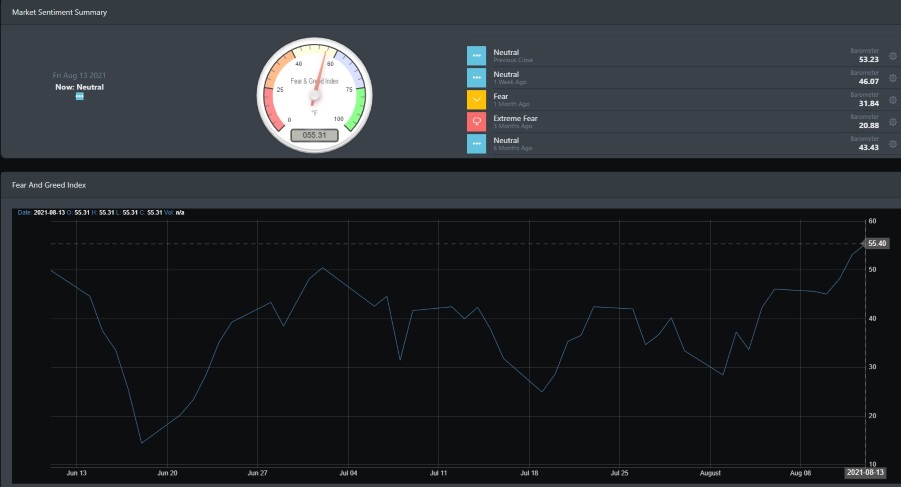
Market sentiment has been in neutral for the good part of August but as of this week has been trending higher toward greed. Although that may happen, it is unlikely. The last time the index hit above 58.74 was back on March 17.
Economic Outlook
Earnings season is winding down but it has all been impressive when looking at the revenue and growth. A majority of the S&P 500 companies reported earnings that were up 100+%. Over 85% beat revenue estimates. Even if the comparison is being made to last year's earnings where a majority of the world experience an economic shutdown, Q2 earnings have been one of the strongest showings in history.
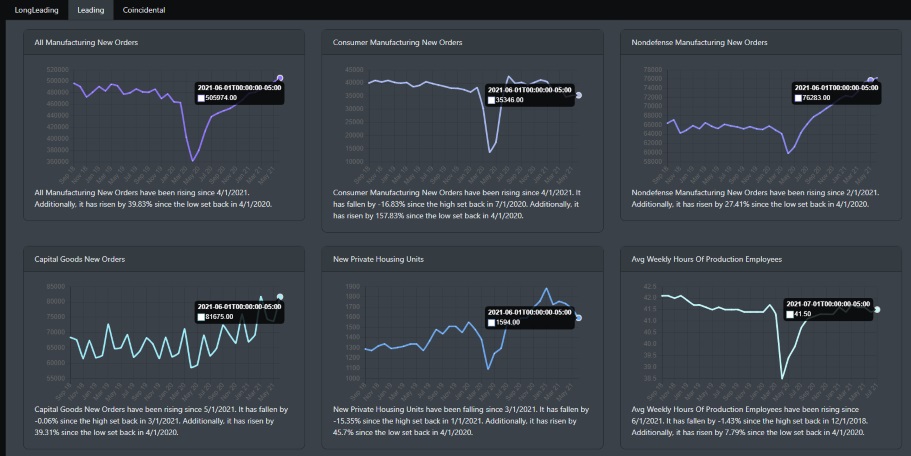
Looking at the leading indicators below, manufacturing new orders and capital good new orders are well above their pre-pandemic levels. Consumer manufacturing new orders has leveled to near pre-pandemic levels. New private housing units are trending lower but well above pre-pandemic levels. The lower trend is most likely due to the housing shortage and increasing cost of raw materials. The average weekly hours of production employees have recovered from the March lows of 2020.
The economic data certainly is on a strong footing. The only outlier that still exists is the labor market. According to JOLTS (Job Openings and Labor Turnover Survey), the number of job openings hit a high of 10.1 million on the last day of June. That certainly tells the story that the economy is opening and expanding. However, the bad news is that there are still currently over 8 million people unemployed.
Market Outlook
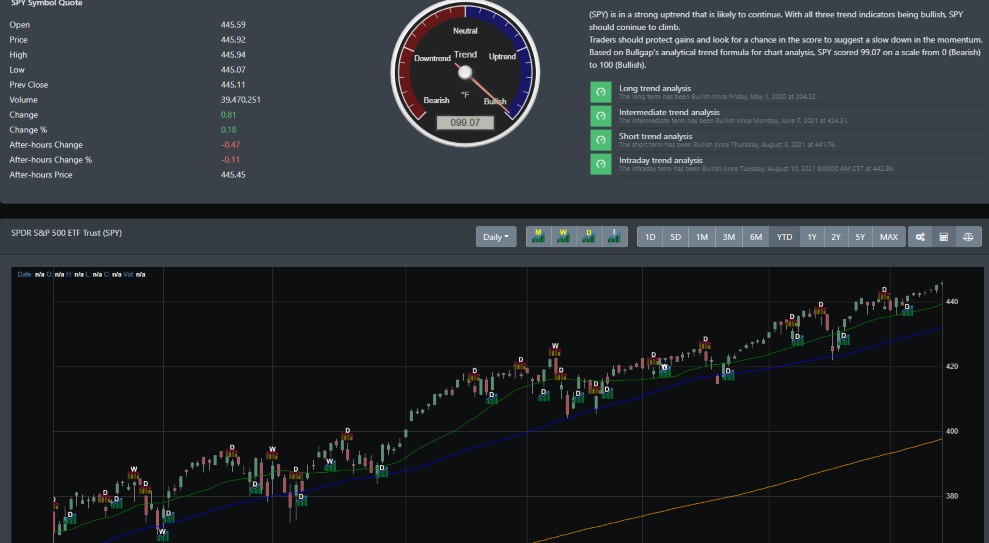
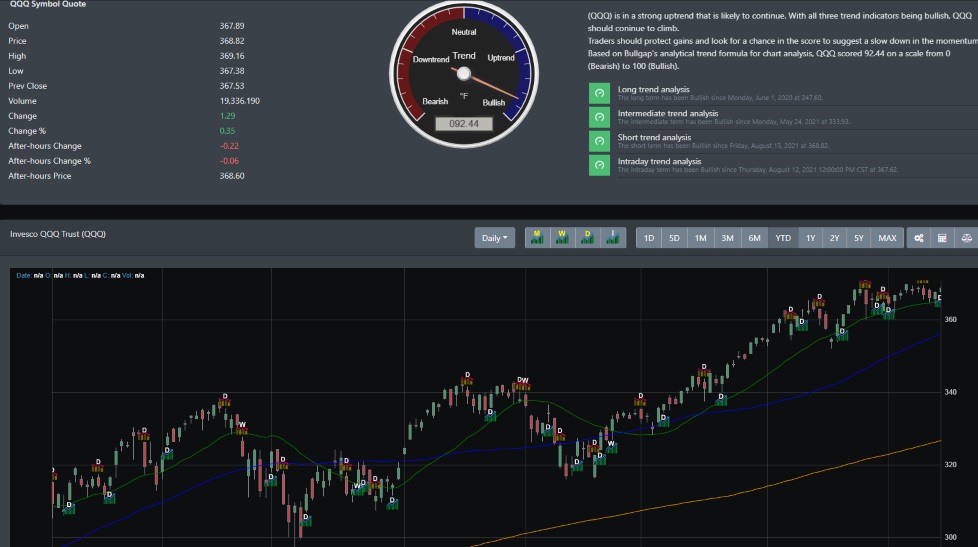
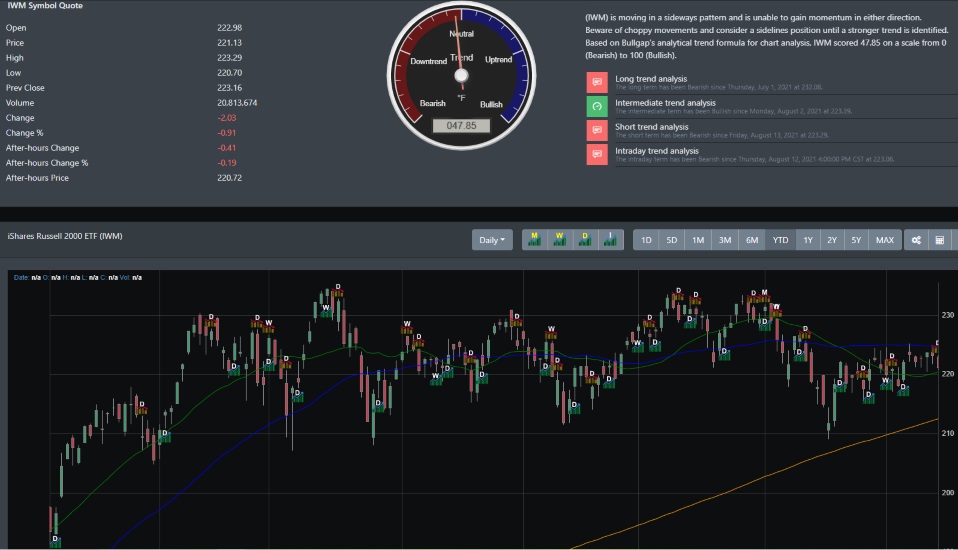
Overall, most major indexes are in a strong uptrend. Today, we will use BullGap's TrendFinder tool to look at the major ETFs indices. BullGap's TrendFinder identifies trends from the monthly, week, daily, and intraday. Let's see what he can tell us about the overall big picture in the market.
SPY
For the most part of 2021, SPY has been in a solid uptrend. Only during mid-February to late March did it consolidate. You can see below the consecutive weekly trend signals indicating buying and selling. There has been no big-picture monthly buy signal and only a few sell signals on the weekly trend. All trend timelines are bullish right now.
QQQ
QQQ also is in a strong uptrend though it has been more volatile due to the inflation worries. Like SPY, it also broke the trend on the weekly timeline around mid-February and May but it started its rally right at the end of May where the weekly buy signal was triggered. Right now, it is currently consolidating.
IWM
IWM as of November 2020 started a rallied that pushed it +45% into the new year of 2021. It has been in a consolidation pattern for most of 2021. Looking below, you will see that it has been quite a volatile year as there have been several key weekly buys and sell signals issued for IWM.
Concluding
The equity market is still grinding higher. However, market breadth is currently showing some bearish signs though nothing ominous (as of yet). It will be interesting to see how IWM (small-caps) fare in the next coming weeks. Any break down below the 200, could mean a drop down to the 189 support line. This could cause a potential buying opportunity for the other indexes as well.