


With the S&P 500 hitting another high on Friday, it is clear that the bulls are firmly in charge. And only a few trading sessions earlier, the S&P 500 was on a 7-day consecutive high streak. That is the longest consecutive streak since dating back to the late 1990s. Not to be left out, both Nasdaq and Dow Industrial also posted all-time highs on Friday's close. And with 2nd quarter earnings about to start this week, the forecast for company profits for Q2 2021 vs Q2 2020 will be strong.
Since the start of this year, there has been much bearish news: The rising inflation will drop the equity market, the market is in a bubble\topping, Fed tapering of QE because of interest rate concerns, COVID resurgence, and negative labor data, etc.
All this speculation and fear has been running rampant and is providing a complex backdrop for investors. One day you may hear news calling that the market is in a reflation trade. The next day it is in a cyclical trading cycle and now it is back to a growth cycle. While you can make talking points about where we may be in the market, one thing is clear.
The secular bull market is still intact and pushing higher. Ex. Many were forecasting that Large-cap was due for a massive correction due to the inflation rise - it has made a new high on Friday.
Big Picture
Coming off of late June's strong performance, the major indexes pushed higher with the S&P 500 hitting highs after highs for 7 consecutive days. Both Nasdaq and Dow hit new highs to close out the week. The strong momentum from last week spilled into this shortened trading week to draw out a clear picture - the technical backdrop is strong and market indices are a reflection of it.
Not all is smooth sailing as small-caps (Russell 2000) reversed after failing to breakout. It is the only major index that is still in a consolidation phase (more on that later). On Thursday, the indexes started to sell off on the overbought conditions and it was interesting to see all the bearish news pundits coming out calling for an economic growth slowdown.
That fearmongering news quickly lost as the S&P 500 made another high (4369) on Friday to close out the week.
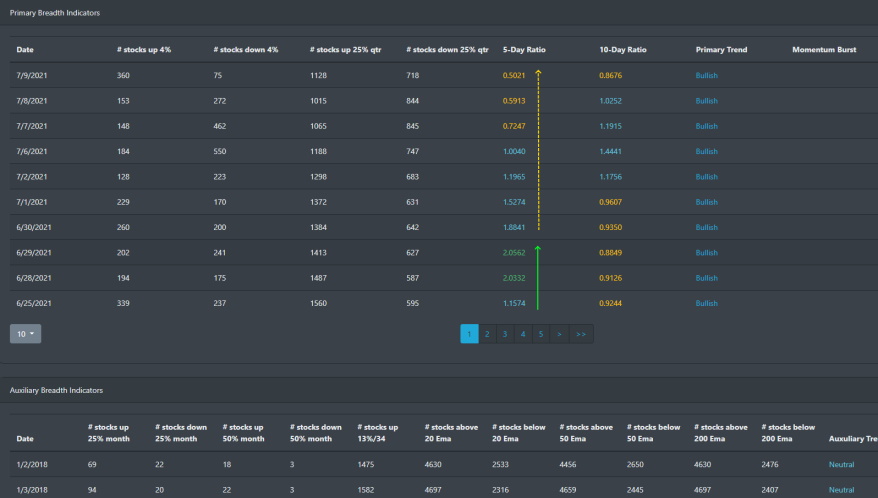
Market Breadth Table
Since our momentum burst for market breadth signal back on May 28, the markets have broken out of their consolidation phase and have been moving higher. In the recent data below, we are seeing a slowing down of the short-term rally. Market breadth is still reading strong as stocks trading above their 20, 50, and 200 EMA are at a high percentage. The number of stocks above the 200 EMA is well above 85%.
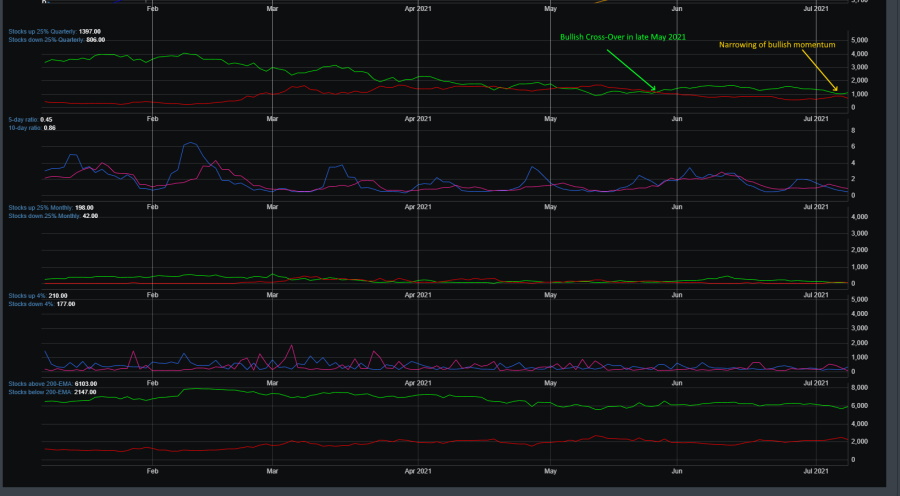
Market Breadth Chart
There was a recent bullish cross-over in late May that kicked started the market push to newer highs. Even with new highs being hit in consecutive weeks, the number of stocks up 25 quarterly vs down is still low. The next couple of weeks will be a strong indicator if we see a small dip come in or if the markets continue on their march to new highs.
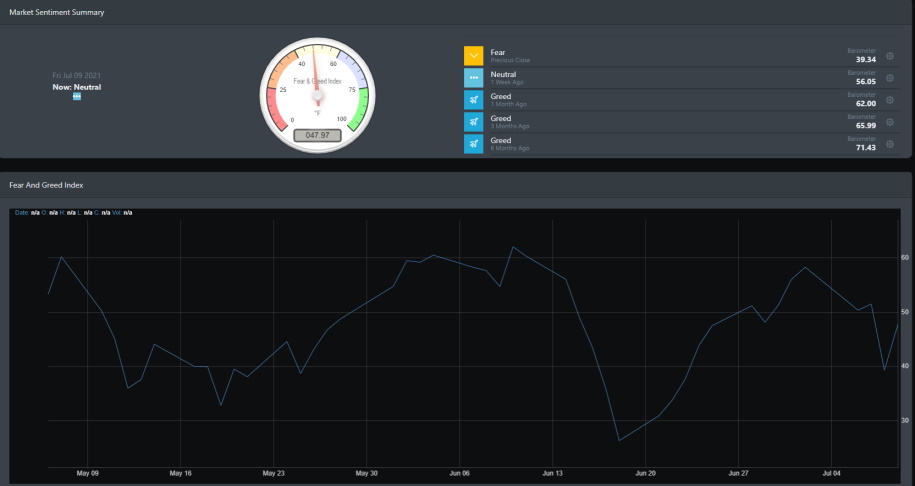
Market Sentiment
For the past month, market participants have been quite bullish. The latest high was hit on July 10 with a reading of 62. Typically, when bullish readings hit above 55 on BullGap's Fear and Greed index, it last on average a few weeks. You will notice the correlation of the market taking a dip when this index dips from reading above 55.
Economic Outlook
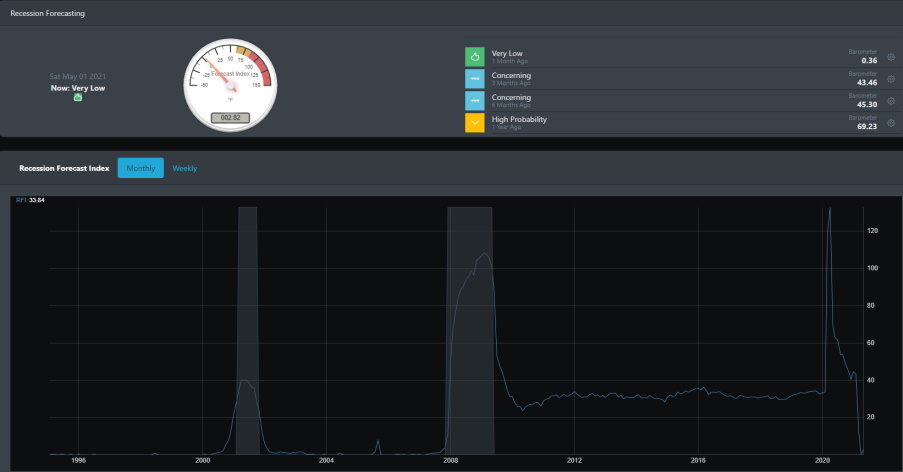
The economic picture is strong. This can be seen in BullGap's Recession index where it has historically predicted the last 7 recessions by a few months in advance. Right now, BullGap's recession index is reading a low of 2.82. This is in contrast to April 2020 when the index was reading a historical high of 132.80. If we were to look at the New York Fed Weekly Economic Index, we would see it projecting 2Q21 to have a growth of +9%. Bottom-line is that the probability of a recession is quite remote.
Long leading indicator
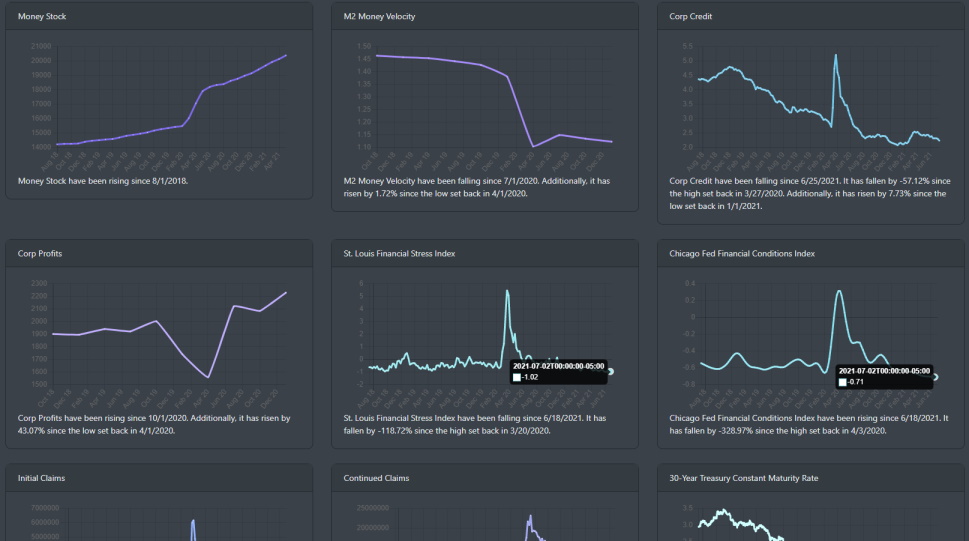
Both the St. Louis Financial Stress index and Chicago Fed financial index are also at key low levels. Since both of these indicators take data from the credit market, it is clear that as of the near future, economic conditions are stable.
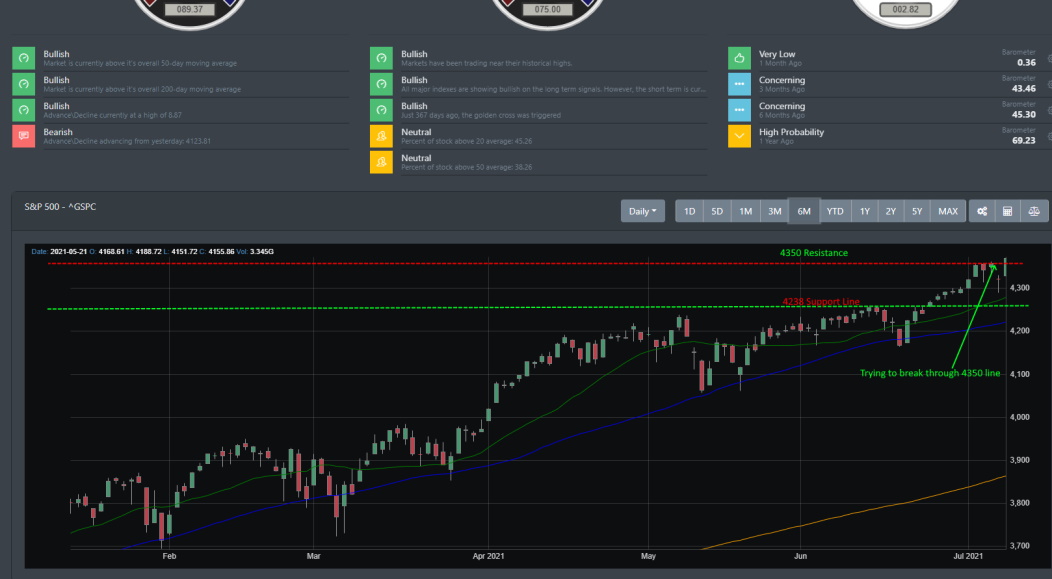
Market Outlook
Outside of small-caps (IWM), all major ETF indexes pushed higher. The "sell-off" on Thursday was lop-sided as profit-taking started in the morning and stabilized in the early afternoon. Prices closed higher on Friday with a large spike in volume. Thursday's drop was literally a blip for this week's strong performance.
Let's take a look at a one-year snapshot of SPY, QQQ, and IWM.
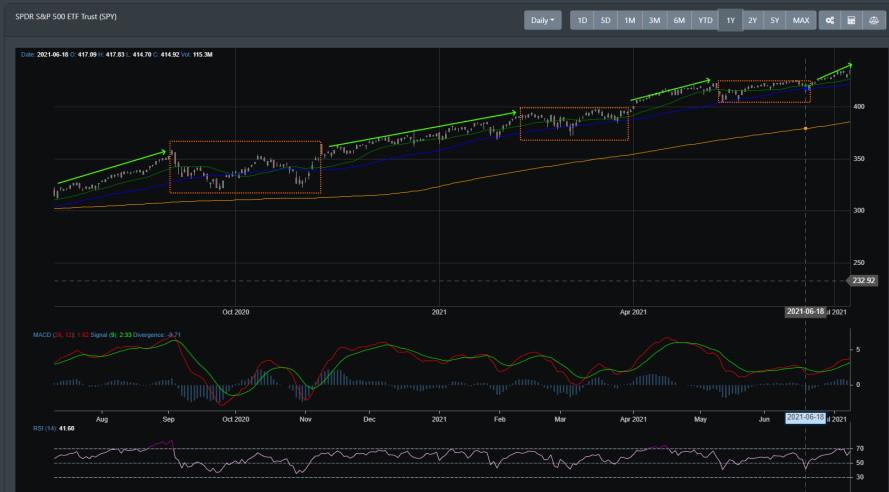
SPY
SPY is clearly in a rally. The major uptrend is intact. As with every bull market, there is a period of consolidation. You can see that below for the past year's outline in the orange box. The most recent consolidation was in May after a dip in April. Since then, SPY has been pushing higher.
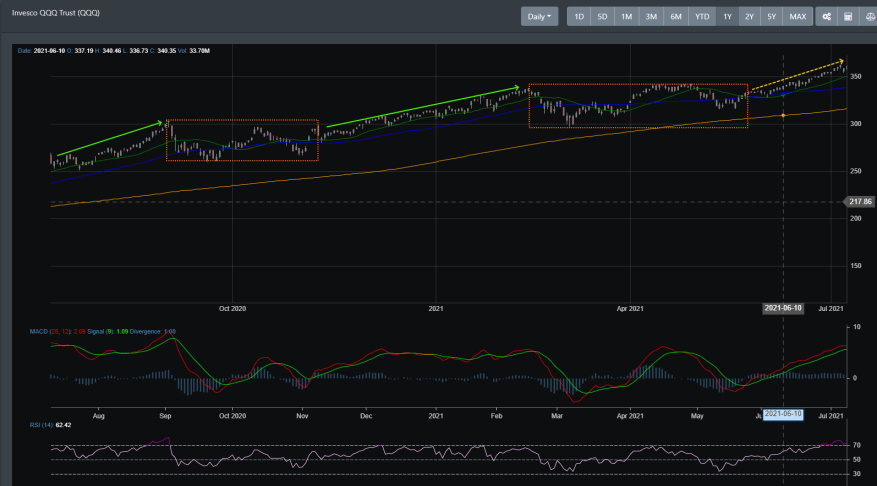
QQQ
For the one-year snapshot, QQQ has the same outlook as SPY. It is clearly in an uptrend and as of recently has been pushing higher after consolidating for most of March through May.
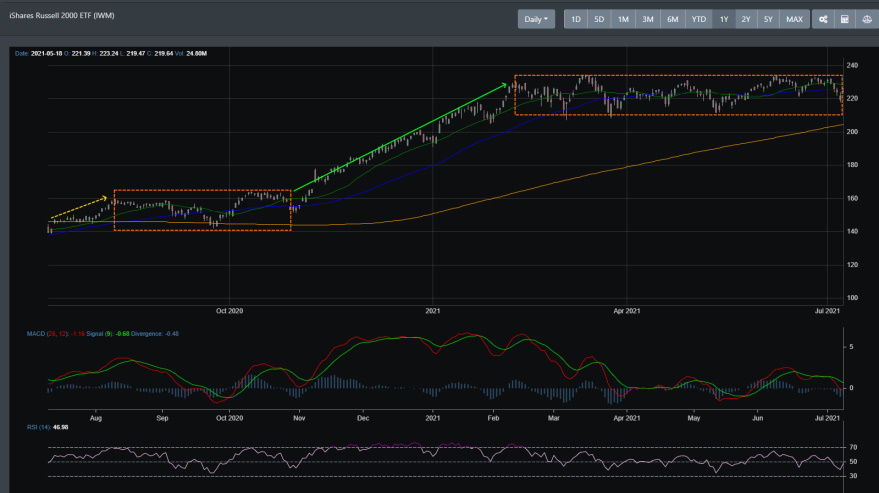
IWM
Small-caps has been in a consolidation phase since February of this year. A few thoughts on this. IWM is coming out of a major rally that started in November 2020. IWM is also reading the 10-year Treasury low as a sign that the economy is slowing down. Additionally, the labor market is still in a disparaging state.
Concluding
Strength beget strength and the secular bull market rally is still intact. Anyone who is following the market news pundits over all the wall of worry regarding the market and economy has been frustrated as the equity markets are pushing higher. If you are in this camp, you may want to evaluate how you read the markets. Are you riding the markets as it makes new highs or are you waiting for the 10% market correction that has been forecasted since the beginning of this year?
When we posted in December that the S&P500 would push to 4300 in 2021, we did not expect it to be this sudden. This past week, the S&P 500 pushed past that resistance line of 4350 and we expect the next major rally to get us to a range of 4530 and 4600. That is the next resistance line. There will be a potential buying opportunity again with a market dip as the technical readings are moving into overbought territory.