


February on average has a performance loss for the S&P 500 dating back to 1928. After three weeks of losses, many market pundits joined the bears to call for another pending crash. Interestingly, this came from the same fearmongers who cried out that markets would crash due to high-interest rates, inflation, surging unemployment, and falling corporate earnings. Much of this rhetoric came near the end of the second half of 2022 when markets hit a low in October.
And where are markets now? Looking at the major indices such as S & P 500, Nasdaq, Dow, and Russell, a different story is being told. The price action suggests a story of a bull market rally. Markets have rallied into the new year with a solid 5% up for 2023. And it is up +12% since hitting the October lows set in 2022.
Big Picture
In our last blog at the start of February, we discussed how strong the technical picture was leading up to February. However, in that blog, we noted several key data points that suggested a high probability of a pullback coming for February.
Overbought technical readings: "A tailwind of a robust technical setup has the bulls grinning ear to ear. The near-term overbought conditions suggest a pullback is in store."
Market sentiment readings: "In a couple of weeks, sentiment reading has gone from the 40 lows (near fear reading) to a near all-time high of 72.36. Looking at the past two years of our sentiment data, it is clear that when near-term sentiment reaches this level, it usually reverts to the lows."
VIX indicator: "The CBOE Volatility Index (VIX) right now is hovering below 20, which has shown to be near the bottom since the start of the COVID-induced crash of 2020. When the VIX has hit this bottom for the past year, there is an immediate, reflexive bounce which causes market rallies to revert."
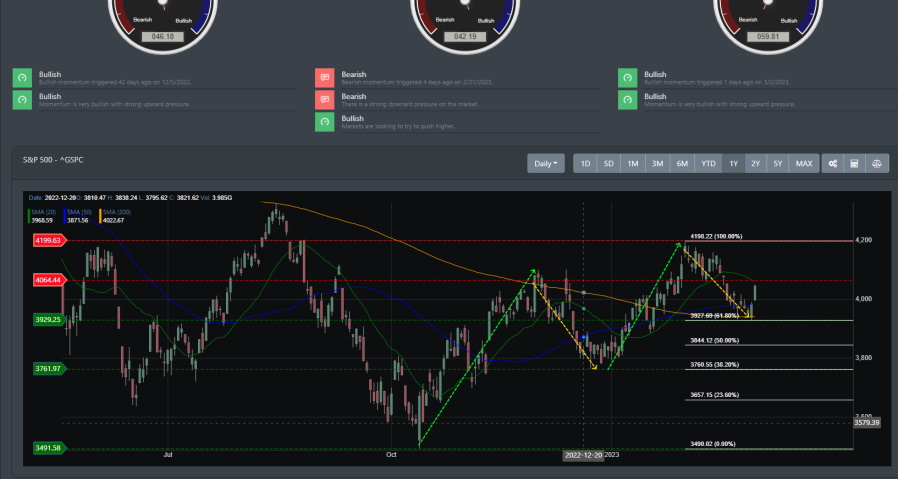
The pullback did occur on the same week we blogged that we expected prices to revert to support. And if you look at the image below, it has been a textbook pullback. If you look at our algorithmic generator for support and resistance, resistance was at 4199.3, and the next two immediate support was at 4064.44 and 3929.25. The S&P fell through initial support at 4064.44, and then this week, in the last two trading days, the price bounced off the 3929.25 support and reclaimed the bullish rally, with prices now above the 200 DMA. The pullback was textbook in how it reached 100% from its October low and retraced to 61.8% this week.
Market Breadth
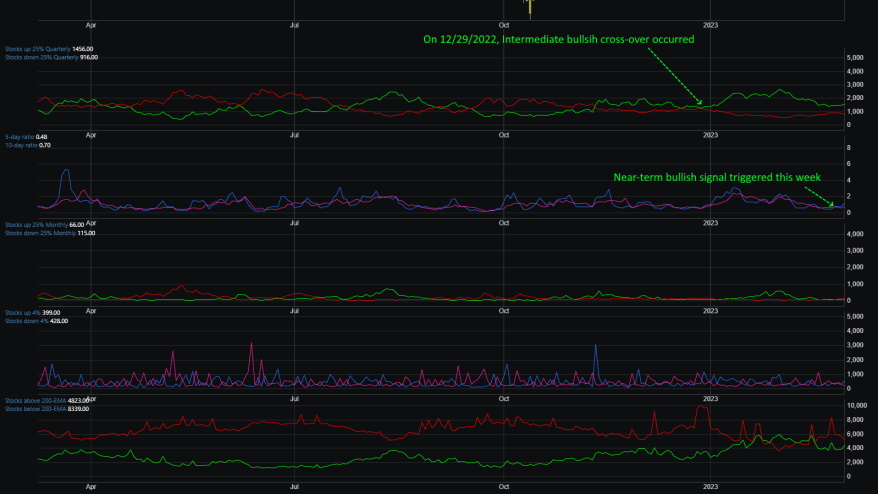
For much of February, market breadth had a bearish tone. However, the intermediate readings are still very much bullish, with our stock readings of up\down 25% quarterly. While the bearish cross-over for stocks above\below their 200 EMA triggered this February, there are now short-term indicators suggesting markets are regrouping for another rally higher.
Market Sentiment
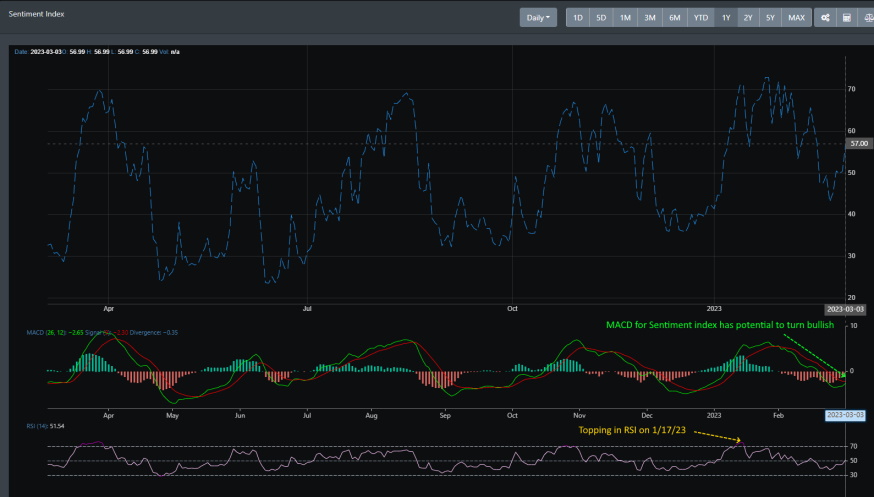
BullGap's market sentiment indicator soared to a near-all-time high (+70) to kickstart the new year. It maintained a greed reading for most of January until recently. February saw the MACD roll over and the RSI top out. March now has a look where there is a good chance FOMO will kick back into gear. Both the MACD and RSI are set to turn bullish.
Market Outlook
All major indices have resolved their overbought condition at the start of February. With much to prove, the bulls rallied in February's last two trading sessions to push the S&P 500 above the 200 DMA. The S&P 500 was only down -2.5% for the month. If you look at the charts below for SPY, QQQ, and IWM, you will see that each indice has followed a textbook rally since hitting their October lows. And recently, all three indices have pullback near their support region, and prices have normalized near the supporting price range.
SPY
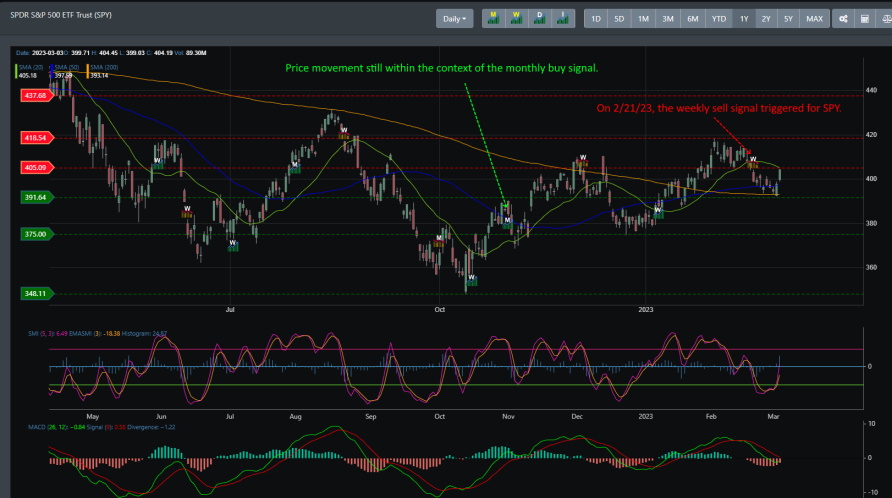
SPY is in a strong rally, with the monthly bullish signal still intact. There has been a recent weekly sell signal that was triggered in February. Still, there is a higher probability that price movement continues within the context of the monthly bullish signal. If this holds, as suggested in the price movements, we expect a weekly buy signal to trigger another rally in the coming weeks.
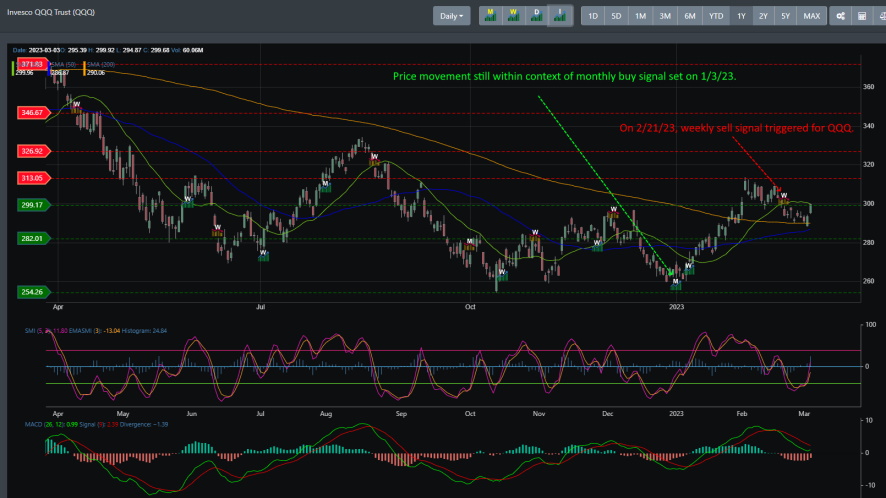
QQQ
Because QQQ follows the Nasdaq 100 index, it has been hit hard in 2022 with recent inflation and rate hikes. However, it is in a strong rally, just like SPY, IWM, and DIA. With the monthly bullish trend still intact, QQQ has the potential to rally higher in the coming weeks. Last Friday, it closed right above resistance (299.17) at 299.68. Though a weekly sell signal did trigger on 2/21/23, QQQ has the look of forming a base and rallying higher.
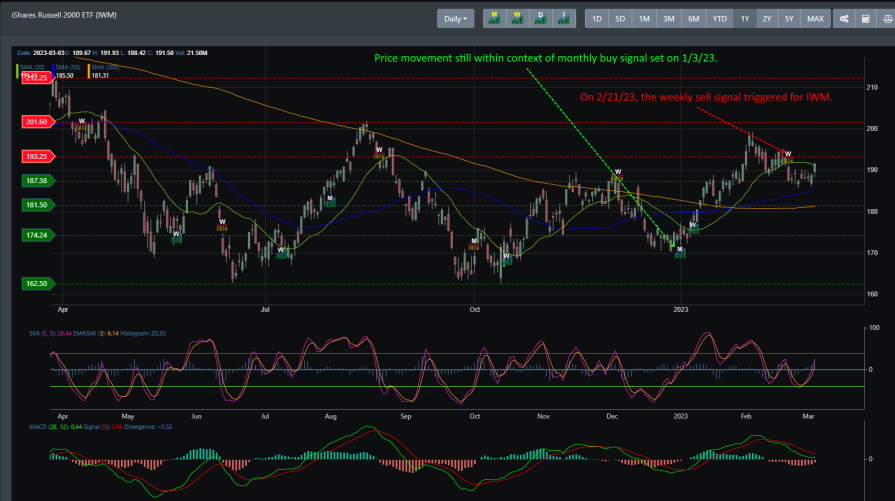
IWM
IWM has been in a strong rally since early October 2022. Even with a recent weekly sell signal, it is still within the confines of its monthly bullish trend. The pullback in February has been very shallow for IWM, with immediate support (187.38) holding prices.
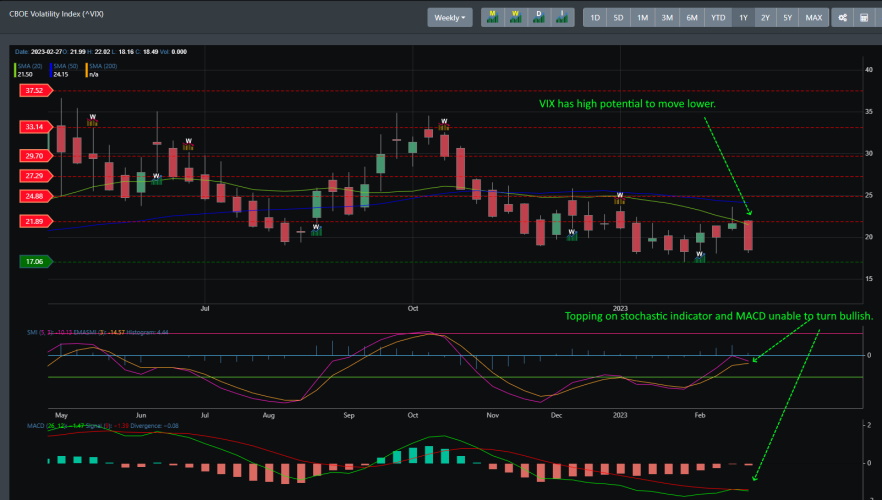
VIX
Let's take a look at VIX from the weekly time frame. As we noted earlier in our blogs, VIX for much of 2022 has been a strong near-term indicator for price movement. Looking at the weekly time frame, we can see that VIX currently looks like it will move lower. Though February did see an uptick, there is much downward pressure in VIX. The weekly MACD failed to trigger this week, and the stochastic momentum indicator is about to roll over, suggesting more downward movement. This all bolds well for a rally in the markets.
Concluding
If you have been following market news, you would hear a lot of gloom and doom over a recession, inflation, and how this will impact the markets by dropping 20 to 25% from where it is now. This same camp of market pundits and bears has been calling for markets to fall for most of 2022. Even when October 2022 saw a low in all major indices, much chatter was going around that markets still had more to drop. And in October, we blogged that we believed a Bull Rally was gearing up.
So, now we are hearing something similar. And could it happen? Anything is possible. It is just a matter of probability and what you believe drives markets and price action. Markets do not top when everyone is overweight bonds. They typically top out when everyone is overweighted in stocks. That is not the case now, and the technical picture and our algorithm readings suggest a potential for more upside coming in the weeks ahead.