


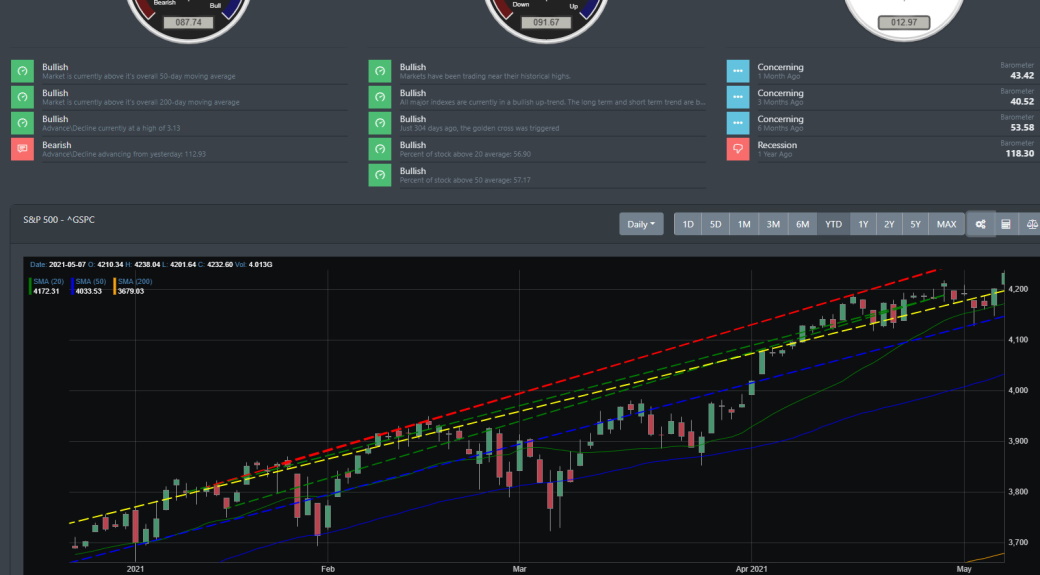
Since late last year, we have been blogging about the continued strength of the market and the economy. Domestically, the economic recovery is well underway with our expectation that global economies getting ready to reopen and help kickstart the economic global expansion. Global PMI data is coming in strong and corporate earnings are posting strong results. The Federal Reserve has reiterated its stance on supporting the economy by keeping QE in place. The only outlier this week was the employment data which the market still shrugged off on Friday.
Market pundits are still calling for a top and warn that the Fed could change policies early to halt inflationary pressure. The only problem with this gloom and doom is that the S&P 500 finished the week at 4232. Not to be outdone, the Dow 30 set new highs and the Dow Transport posted a new high every day this week.
Big Picture
It was obvious that the start of May would be the focus on the Reflation trade. Financials, Materials, Energy were moving strong while the technology sector lagged behind. On Monday and Tuesday, the S&P was down less than .6% while the Nasdaq fell more than 1.5%. Tuesday was interesting in that the Treasury yield dropped to a low of 1.56% and then immediately pushed back above 1.6% on the same day. The Nasdaq which has recently dropped when the yield rises rallied late on that day. As the week ended, the Dow 30 push to new highs and S&P 500 wrapped up closing above 4230. Nasdaq and Russell 2000 both pushed higher n Friday to post positive gains for the week.
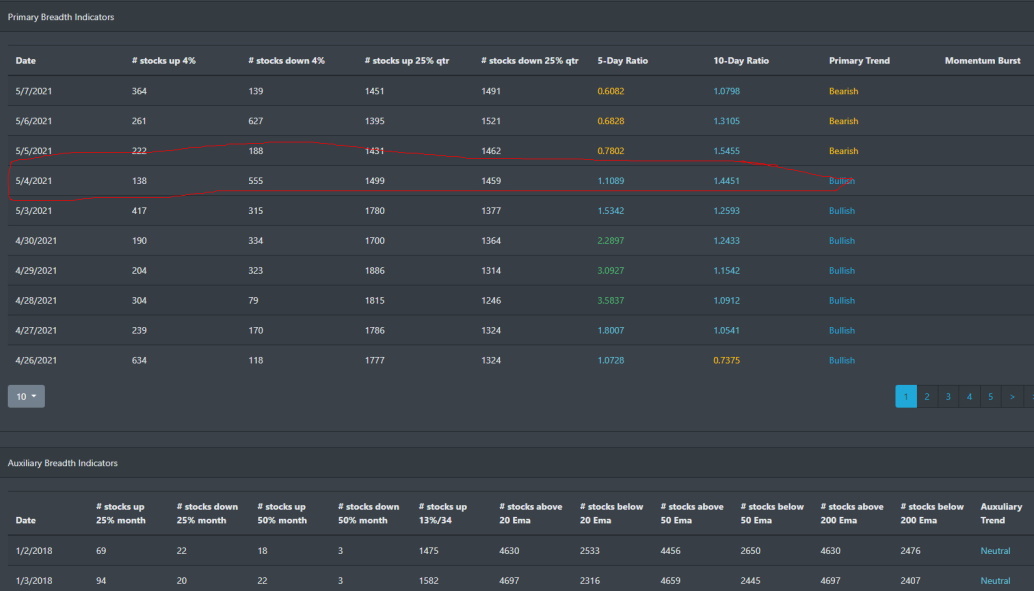
Market Breadth Table
From the table below, we can see that investors were wary to start May. Maybe the old adage of "Sell in May and go away" was something that was on the mind of investors to start the week. In either case, market breadth slowed for the first part of the week but is now gaining momentum as the 5-day ratio is looking to cross over possibly this coming week.
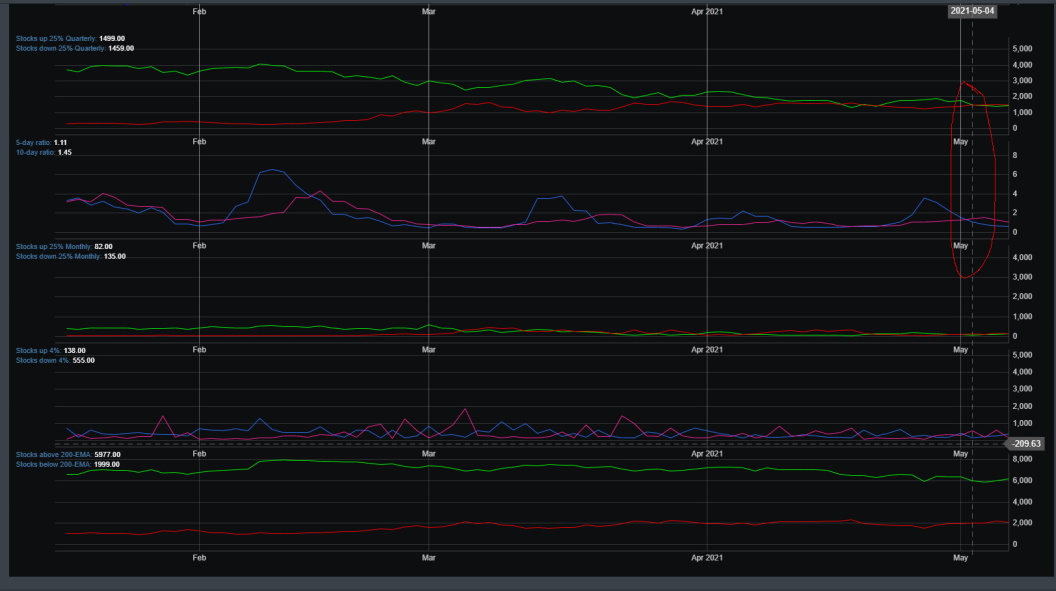
Market Breadth Chart
Market breadth is still strong and right now there is no indication of a reversal. The 5-day to 10-day ratio crossed over to the bearish side to start the week but is now looking to cross over to the upside. There is a high percentage of stocks trading above their 50 and 200 EMA.
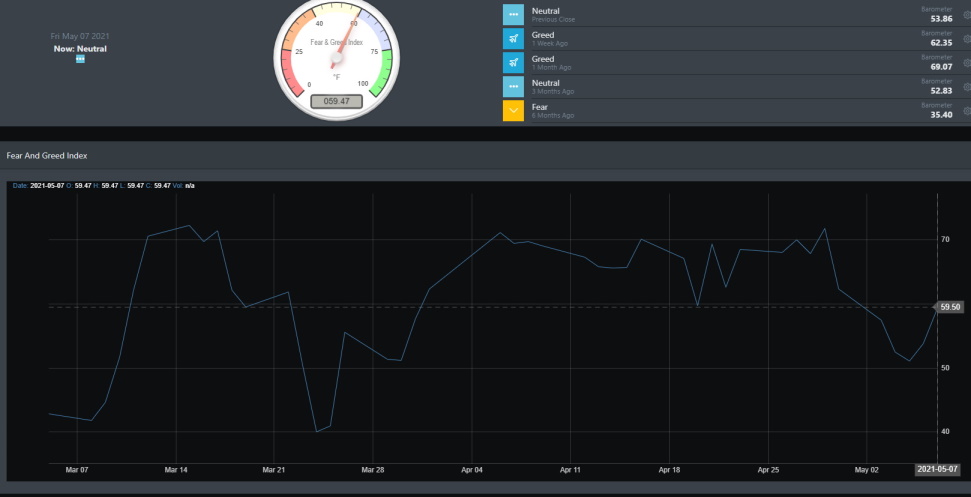
Market Sentiment
Market sentiment took a dip to start the week. This was expected and something we discussed a few times in our previous blogs. BullGap's market sentiment index historically does not stay at such a highly elevated level for such a long duration. For the month of April, it has been above 65 for an extended period of time. With so much exuberance and bullishness in the market, we expect the index to push higher in the coming weeks.
Economic Outlook
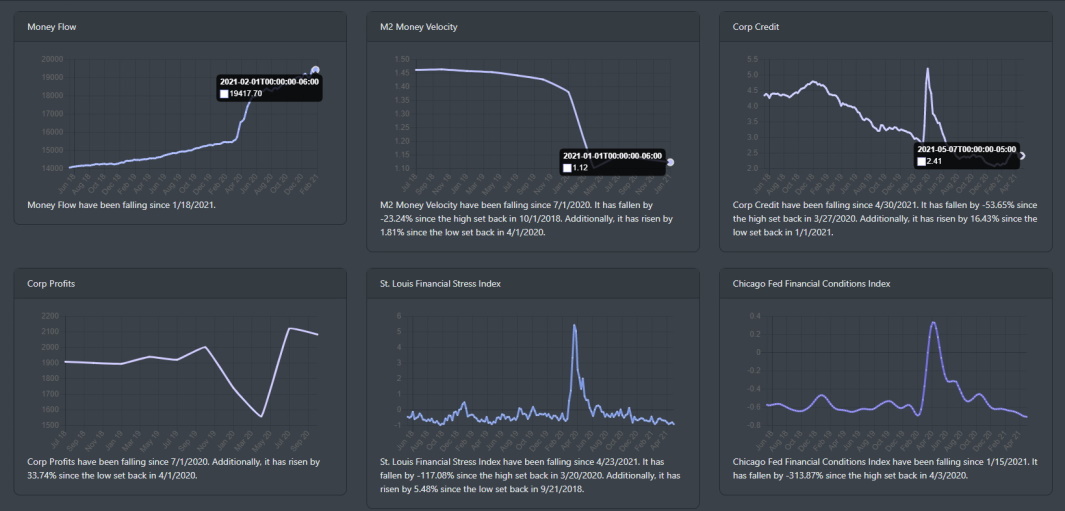
Looking at the Money Flow index below, it is clear that there is ample liquidity in the market. The Feds are keeping quantitative easing in place for the foreseeable future and markets are pushing higher because of it. Corporate credit has risen but is at historically low levels. Both the St. Louis Financial Stress index and Chicago Fed Conditions index are both at pre-pandemic levels.
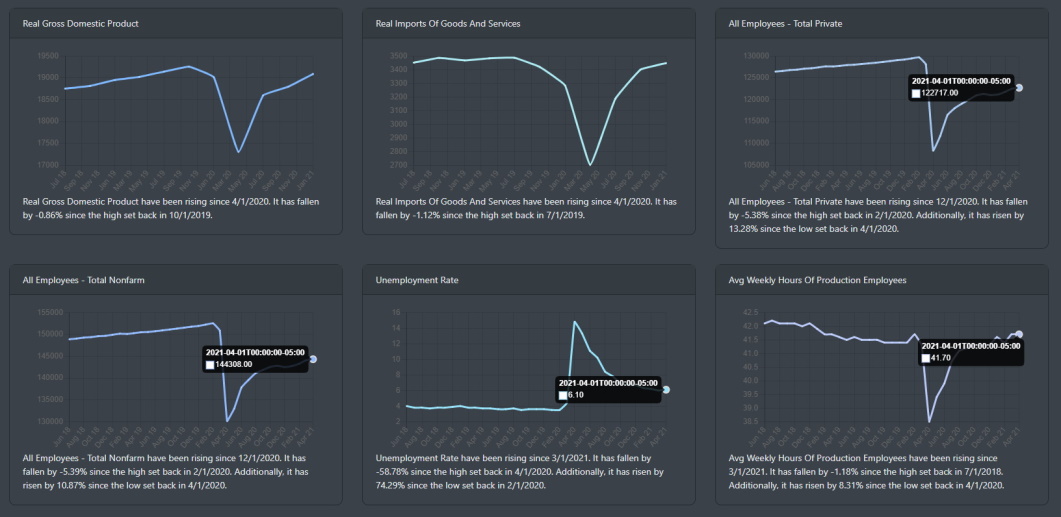
While a good portion of the economic data has posted a V shape recovery, the employment report that came out this week is anything but flattering. While the civilian labor force increased by 430,000 in April, the chart below paints a different picture. The all-employees (total nonfarm and private) show that slightly more than half of the labor have recovered before the pandemic hit. The unemployment rate is hovering at a high of 6.10.
Market Outlook
This week has been lopsided as large-caps and midcaps were the highest performers. DIA posted a strong performance this week while IWM consolidated for the week. Energy, Materials, and Financials lead the way this week.
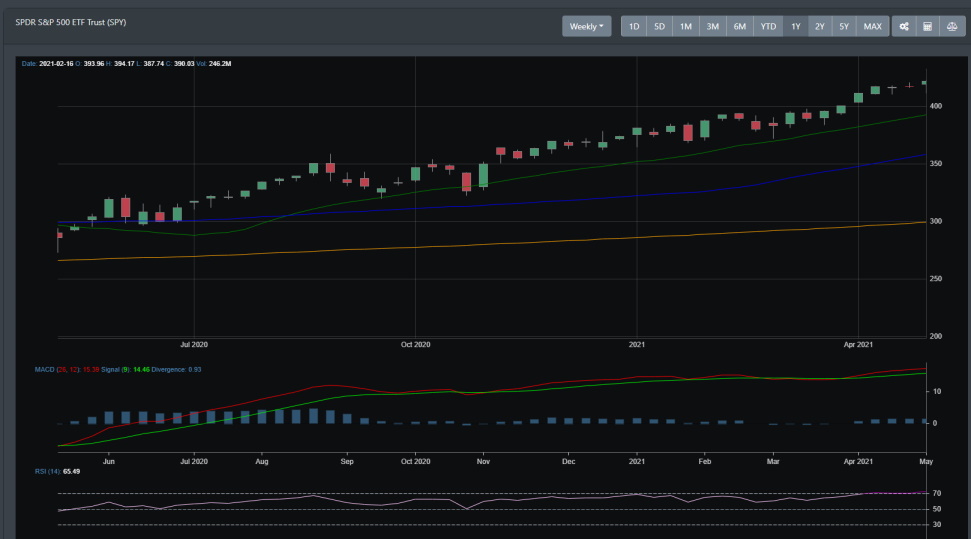
SPY
SPY closed the week in the green territory with +.67%. That is +12% year-to-date. Let's look at the weekly chart to take a look at the bigger picture. SPY is clearly in an uptrend. MACD is bullish with both the 50 and 200 DMA trending up. On Friday, SPY broke through resistance to hit an all-time high.
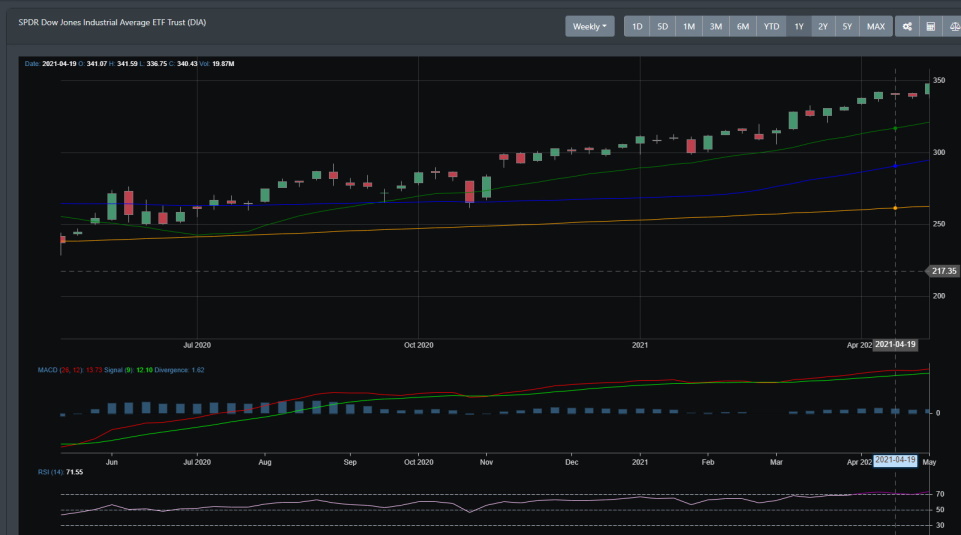
DIA
Like SPY, the Dow has been in a strong uptrend since March. There is a paradigm shift that seems to be occurring with the markets as investors are moving more from small-caps and into large-caps.
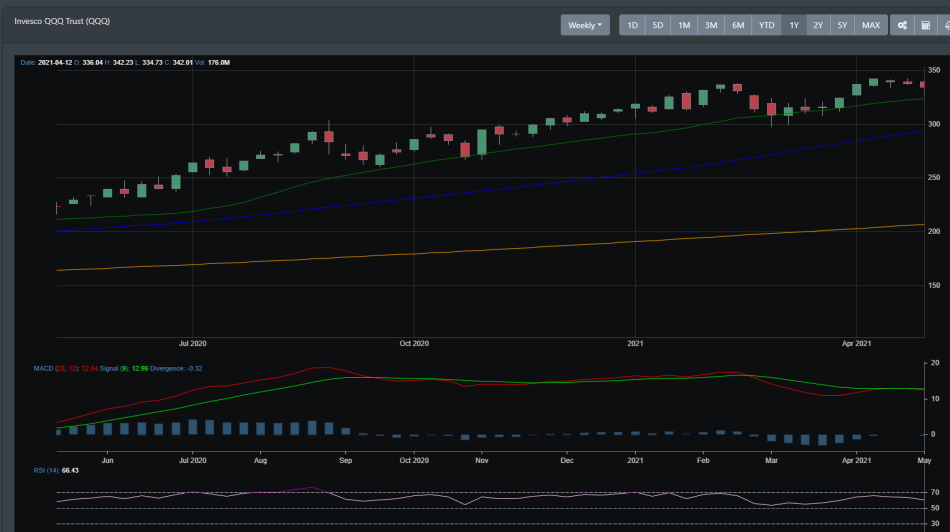
QQQ
QQQ is having trouble pushing above the 330 to 340 resistance line. Late last week, there was a strong push to move higher but for now, it looks like the tech sector is consolidating.
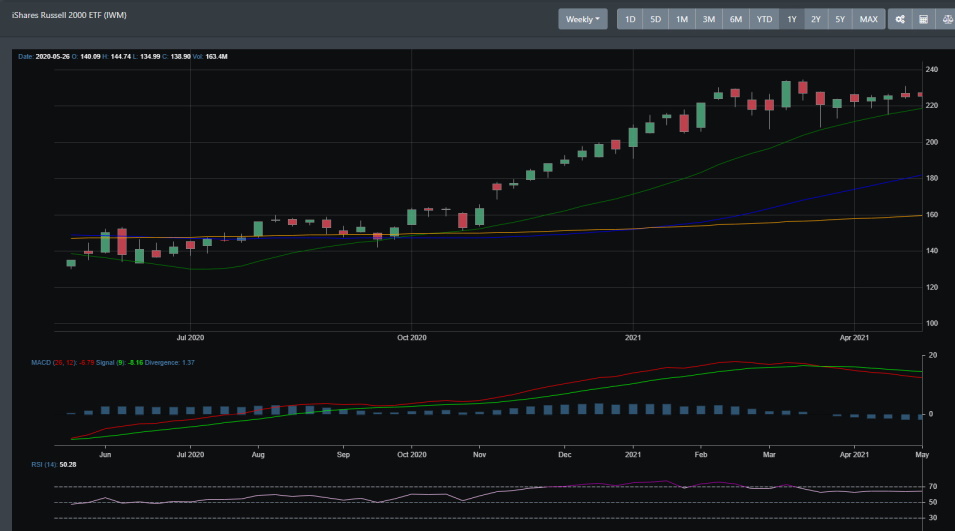
IWM
For the past 6 months, small caps have been in a strong rally. Only until mid-March has it started to consolidate. It is now trading between the range of 210 and 230.
Concluding
If you ever acted on why the market moved based on the news outlet, it is probably a sure bet you are in the red. Case in point. On Friday, the job reports came out where economists were off by 75% of expectations. The job report was a big step back to what was considered the beginning of a strong economic expansion. With such an unexpected and surprising news event, one would have thought the market would have tanked on Friday. Right? Well, guess again. The market pushed higher with the S&P 500 hitting another all-time high.
So, for many who are ready to go by the strategy of "Sell in May and go away" - you may want to rethink that strategy. If you followed this mantra last year, you would have missed out on a huge rally that took place in May 2020.