


Recent worries of rising rates, inflation increase, and calls of topping patterns by market pundits have engulfed the financial market. To further complicate matters, there has been worries regarding the steepening of the yield curve. The only problem with that comment is the yield curve trough occurred in August 2019 with 0% on 10 years minus 2 years. That correction did happen but right around late February\March 2021. With an improving economy, we expect to see rates rise. The Feds are taking a wait-and-see approach to the opening of the economy and rising rates.
Though there was quite a bit of news of market pundits calling for a market crash, market top, Treasury yield sinking the market, we discussed in our last blogged how we see this as a mere correction due to cyclic rotation in the market. As of this writing, all major indexes except the Nasdaq ended this week on new highs. By the end of this week, the S&P 500 was 2.7% higher, the Nasdaq gained 3.1%, Russell 2000 jumped 7.4% and the Dow had a very impressive +4% gain.
For the past decade, the Dow (DJIA) has vastly underperformed when compared to its peers (Nasdaq and S&P 500). For the past week, the Dow is seeing a resurgence and this is due in part to the current rotation in the market caused by rising rates. Equally important is the fact that the Dow is price-weighted in such a way that it encompasses value-oriented sectors such as healthcare and financials (opposed to high-flying stocks).
Big Picture
For the past few weeks, the near-term picture has centered around rising interest rates, inflation, and the steepening of the 10-year Treasury yield. The week ended with all major indexes posting new highs. It wasn't all rosy to start the week as selling pressure on Monday pushed both the Nasdaq and S&P 500 down. Meanwhile, the Dow was well positioned with its portfolio of Financials and Industrial and saw an intraday high on Monday. The turnaround came on Tuesday as the S&P rallied to hit its 9th and 10th new highs for the year. As investors clamored to small caps and rotational sectors such as Energy (XLE) and Financials (XLF), we saw the IWM hit its 7th new high for the year.
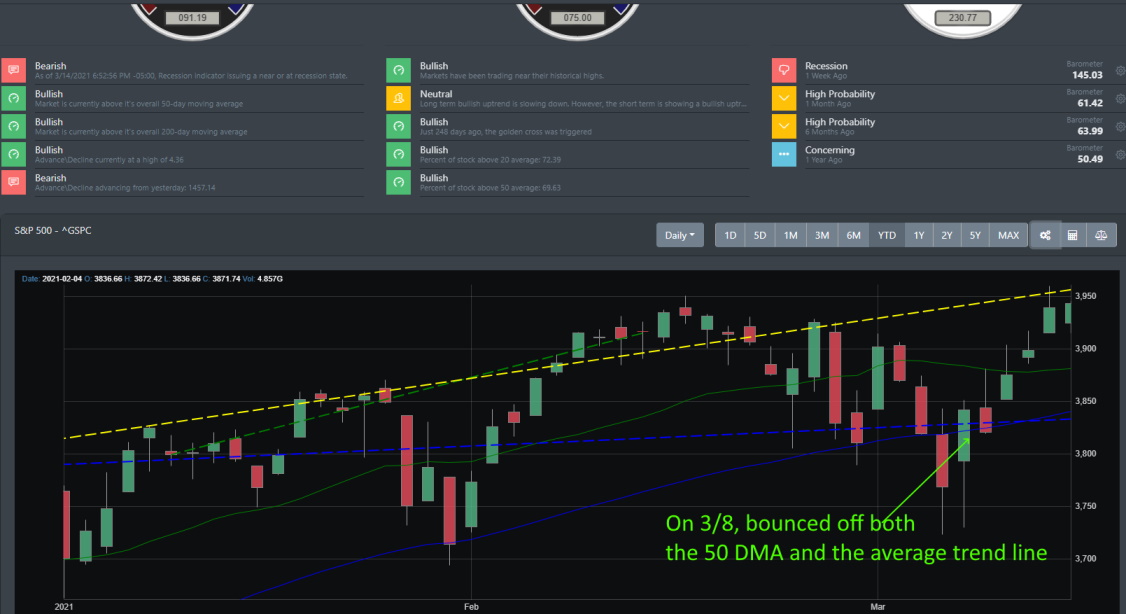
The below chart shows the market movement where the S&P was right on support on 3/8. It did the reversal on Tuesday to reach new highs and is now testing the new resistance level (yellow dash)identified by BullGap's resistance and support algorithm.
Market Breadth
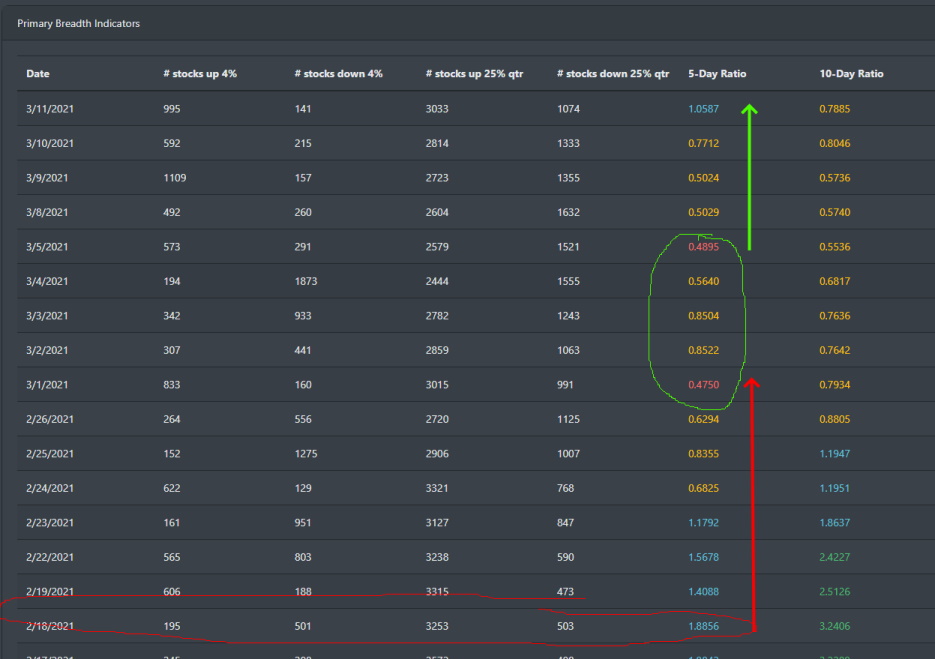
Looking over at the overall breadth of the market tells a very interesting story to identify the market bottom even during a correction. On 2/18, we can see the 10-day ratio climaxed and dropped the following week. The market correction had begun. For the first week of March, we can see the market normalizing and reaching a bottom. Last week, we can see the market breadth rising and breaking out of the market correction.
Market Breadth Chart
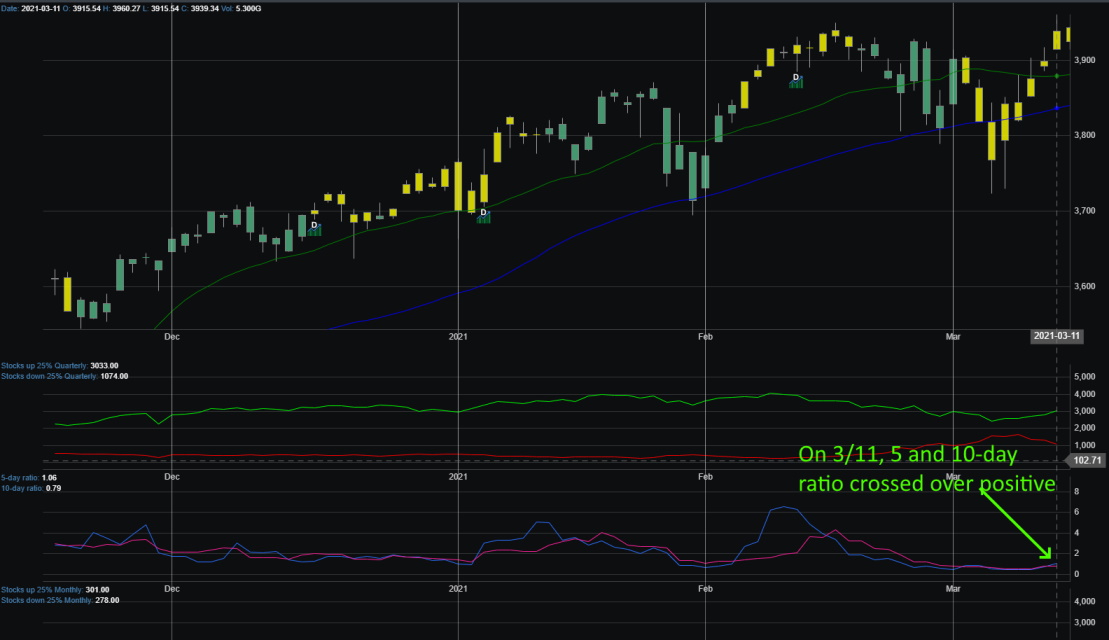
As noted a couple of weeks ago from our blogs, our Market breadth indicators were signaling a correction. As of 3/11, one of our primary indicators for the market bottom is indicating a positive cross-over. In this context and with major indexes closing out the week with new highs and a large percentage of stocks still above their 200 EMA, the market correction is over.
Market Sentiment
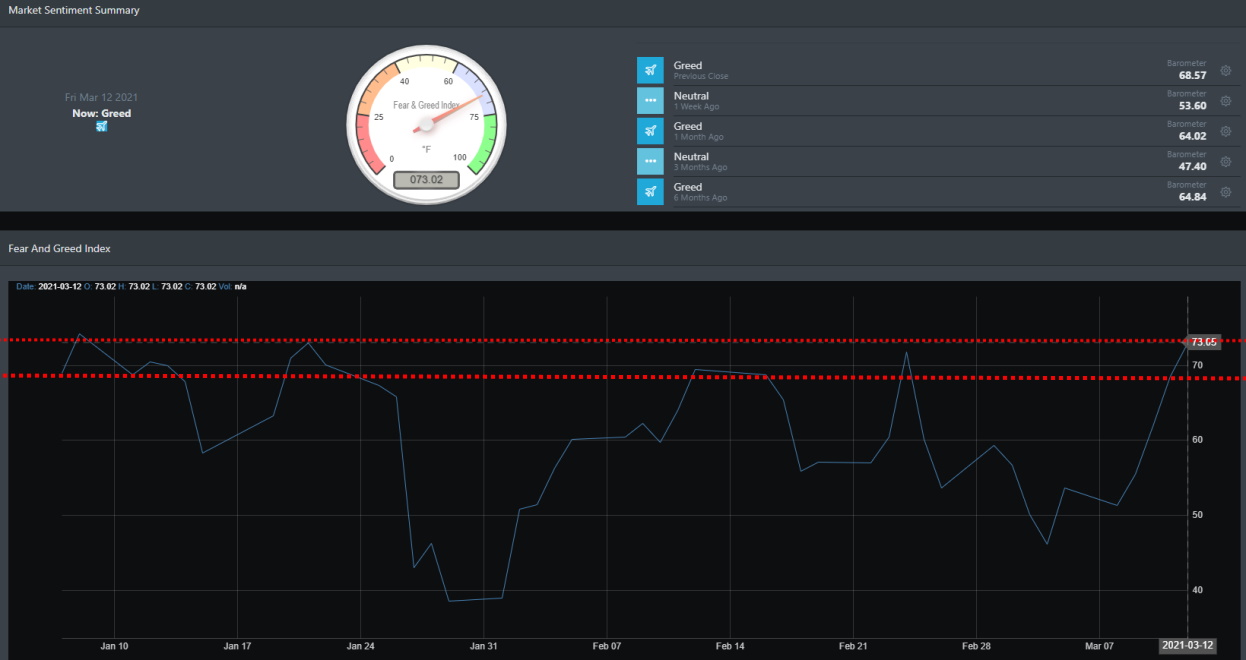
Just by looking at the index for the past couple of weeks, one can see how volatile the market has been. With investor's mood swings going from a high of 71.80 in one day to a low of 46.19 on Thursday 3/4. Since that low of 46.19, investor bullish sentiment has pushed the index back into a high of 73.02. Subsequently, the S&P 500 followed suit and has hit new highs for the week. As we have discussed numerous times in our blogs, when BullGap's market sentiment index hits 68+ there is usually and dip that follows in the next few trading sessions. This also coincides with the S&P 500 taking a drop.
The two red dashed lines are the zone area where historically when the index hits this range, there is a subsequent dip in the market (on or after a few trading day sessions).
Market Outlook
The reflation trade continues as we can see a familiar pattern in the market with investor trading. For the week, small caps (IWM) led the market performance while larger caps gained modestly. The Treasury market was all in the red.
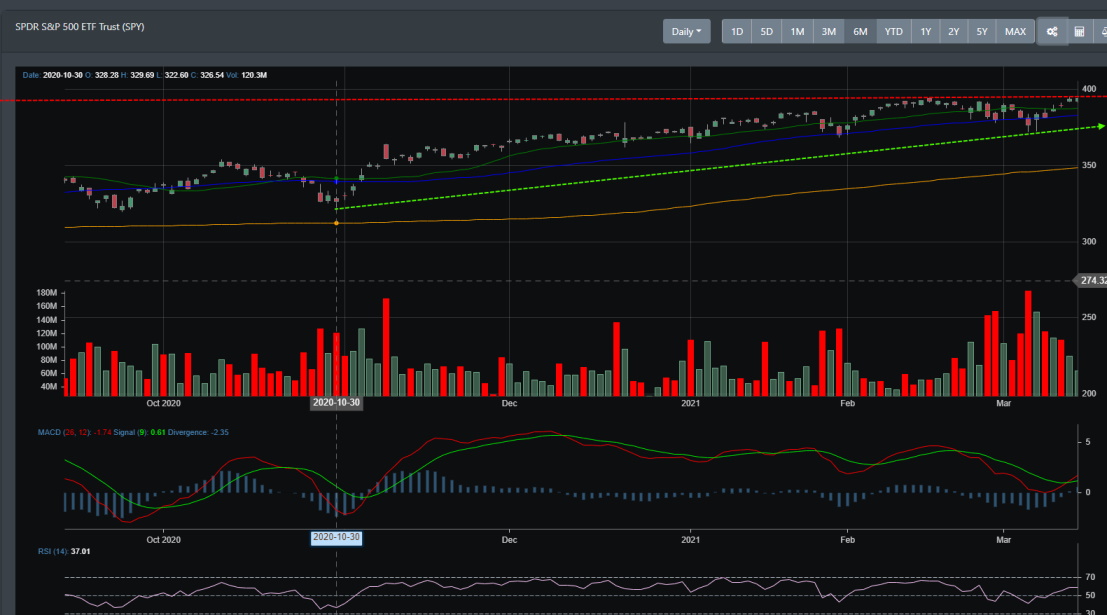
SPY daily
After the last correction in November, SPY has been in a solid uptrend. Only recently has it moved lower. Since January, the market Rally has stalled and the upside has been limited. Right now, SPY is testing support with lower volume.
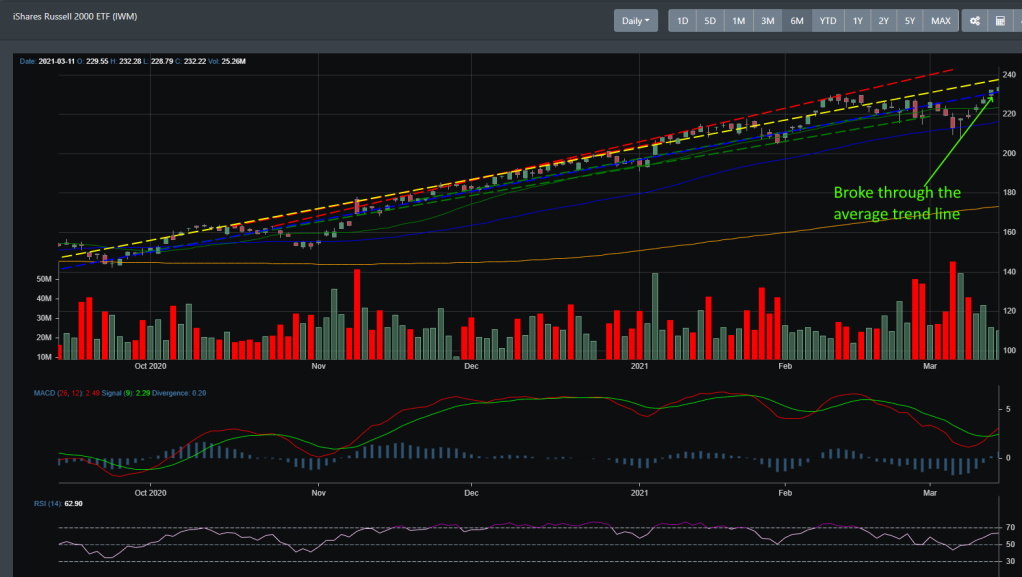
IWM daily
Small caps have been the biggest performer for the past 6 months. Since coming out of the November correction, IWM is currently in a strong rally. Just like SPY, it broke that trend recently to test its 50 DMA. It has just recently broken its average trend line.
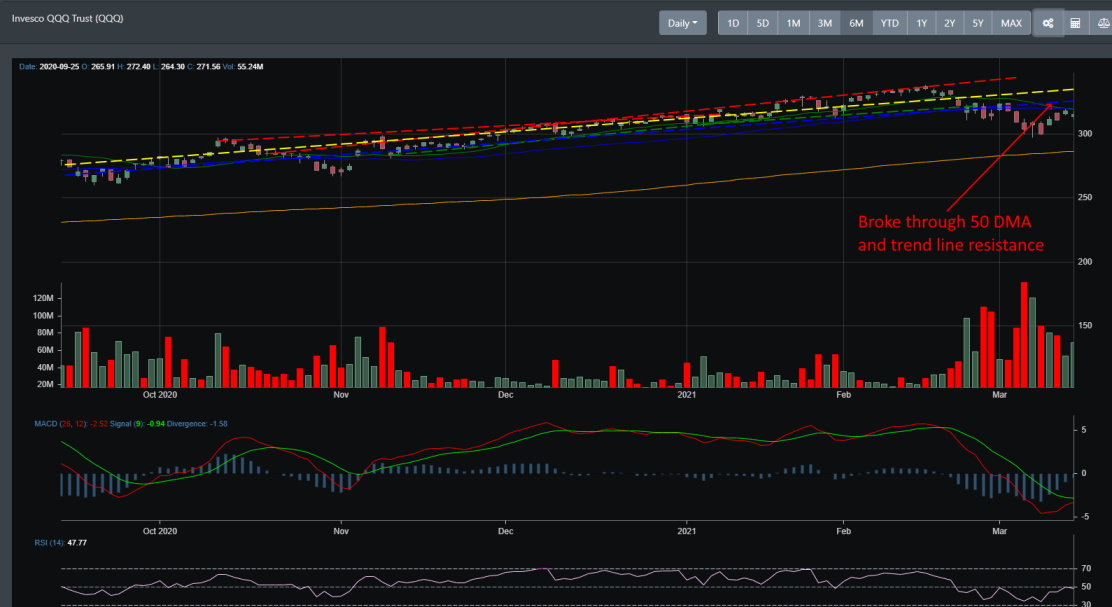
QQQ daily
Large caps were the major player during the pandemic rally. During mid-February, the selling started as traders took profit and the reflation trade commenced. You can see in the chart that volume accelerated as the selling continued. Prices broke through through several key resistance lines and are now testing the 50 EMA.
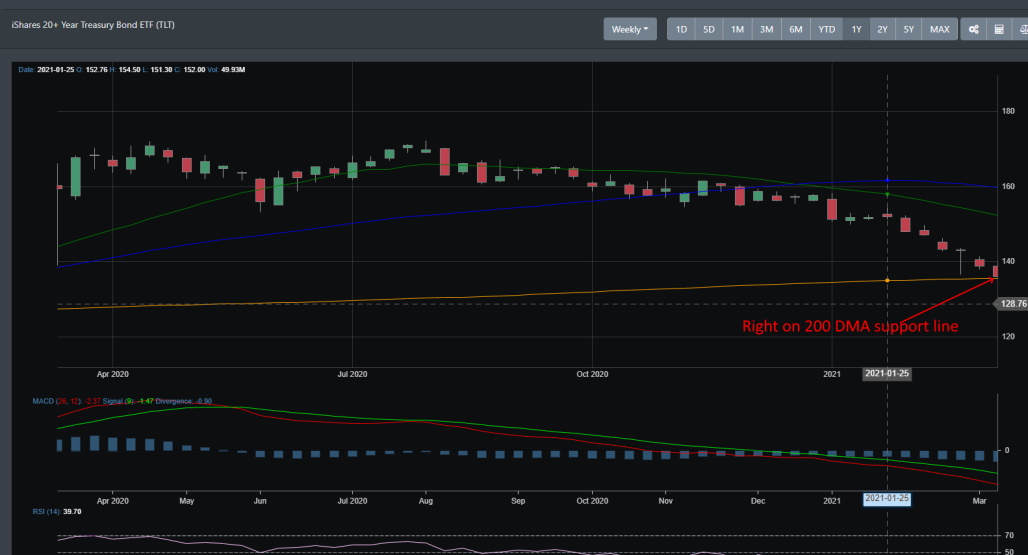
TLT weekly
Looking at the weekly chart, TLT has been on a downtrend for the latter half of 2020 and into 2021. It is currently right on the 200 DMA support line. It is interesting that only recently that this downtrend has started the tech selling.
Concluding
There has been a lot of news coming out with regards to a market bubble that is currently in play. However, taking a look at our market breadth readings, the current market condition looks to be more of rotation than a topping pattern. With more stocks hitting their 52-week highs and a large percentage of stocks above their 200 DMA, the market is still in the grasp of a Bull Market. The Tech selloff can be more attributed to its outperformance and shift to value sectors such as energy, financials, and industrial.
With that said, the Fed continues to support the economy, a new 1.9 trillion stimulus package is on the way, COVID-19 cases are regressing and the reopening of the economy has all the signs of a huge correction. All these cases are bullish for the markets.