


All major US indexes have been in decline since the start of 2022. This week was the sixth consecutive loss for the S&P 500, Nasdaq, Russell 200, and Dow Jones. Though CPI and PPI data suggested a cooling period, it did not stop the bearish sentiment that has hit the market for most of the year. In our last blog, we mentioned that there was a high probability that a short-term rally was in play. That certainly did happen the week of 5/2/2022. However, it was short-lived as the S&P 500 was unable to hold the 4225 support region. For the first time since March 23, 2020, the S&P 500 traded at a 52-week low this week.
Big Picture
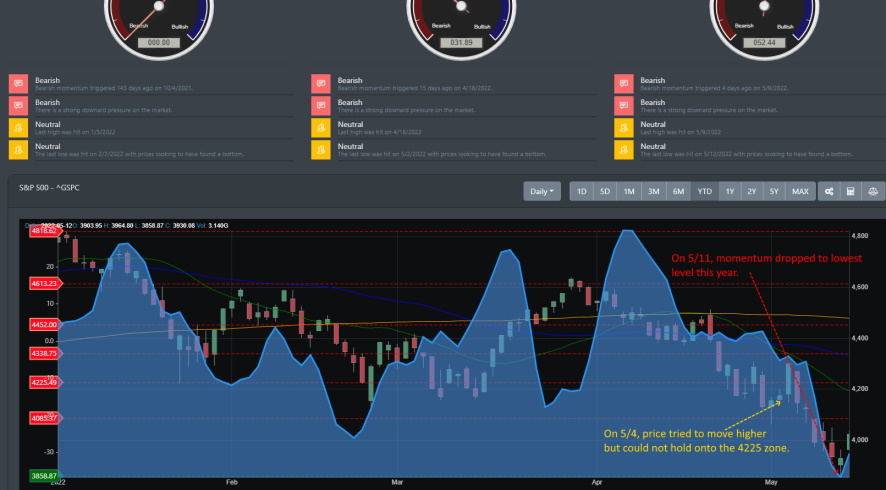
With the S&P 500 falling within the 3800 to 4000 range, markets are clearly pricing in a recession. However, the momentum gauge that measures had the lowest drop this year when it hit near -40 on 5/11/22. Historically, when the momentum index reaches such a low level, it typically signifies a bottom and support has been struck.
Market Breadth
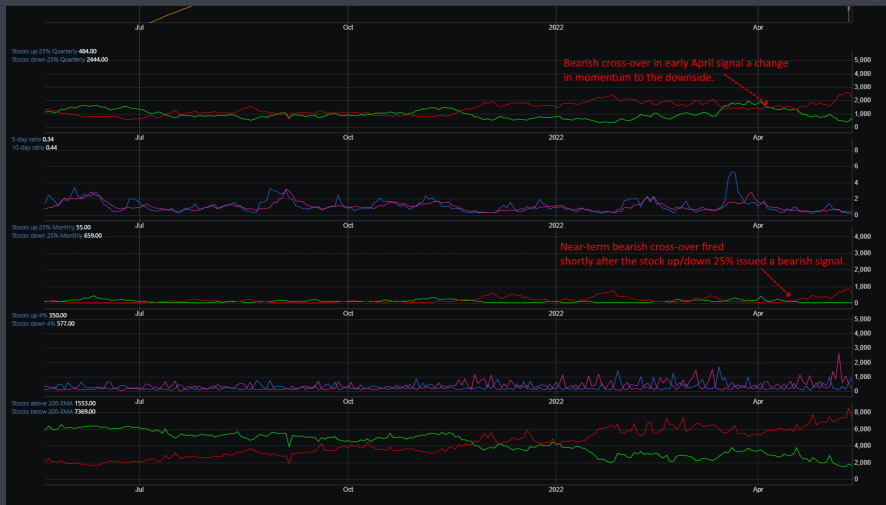
Market breadth has been deteriorating for most of the year. Two bearish signals fired in early April 2022, suggesting that both the near-term and bigger picture time frame were going to see some downward pressure.
Market Sentiment
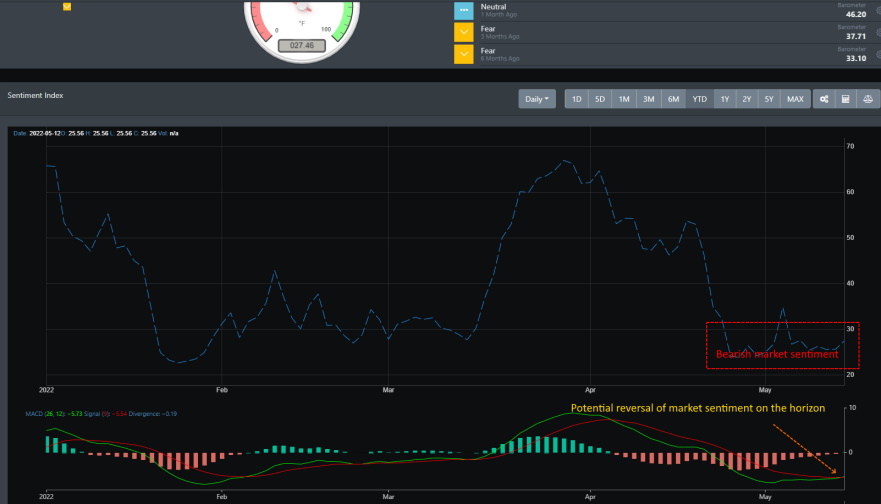
Every financial news article that comes out now is concerned with inflation, stagnation, recession, and a bear market. Market sentiment has been consolidating near the 25 to 27 bearish reading for most of May. It pretty much sums up the market environment as we see it. Everybody is bearish. Net flows into the equity market have turned negative with both institutional and retail investors trading with caution. In a bull market, this level of bearish sentiment typically offers the contrarian bullish view. However, this begs the question as to if we are still in a bull market or at the early stages of a bear market. If we are indeed at or near a bear market, negative sentiments can stay bearish for quite some time with the markets in decline.
One note is that the MACD for market sentiment is trending bullish.
Market Outlook
The technical backdrop clearly shows that the bears are in control. Financial news articles further drive home to investors that the bear market is upon us and a recession is imminent. However, the current technical picture also shows market conditions as being highly overbought.
SPY
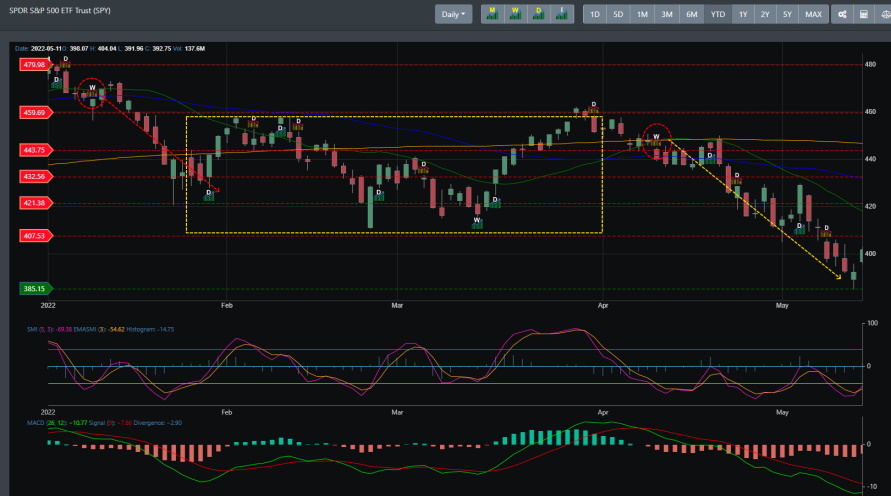
Looking at SPY year-to-date (YTD) clearly shows a downtrend in the larger time frame. The monthly time frame triggered a bearish reading on 1/3/2022. That was followed by a weekly bearish reading on 1/10/2022. SPY corrected to the 432 support region and consolidated before giving way to another weekly bearish signal on 4/11/2022. It recently dropped to its lowest level for the year on 5/12.
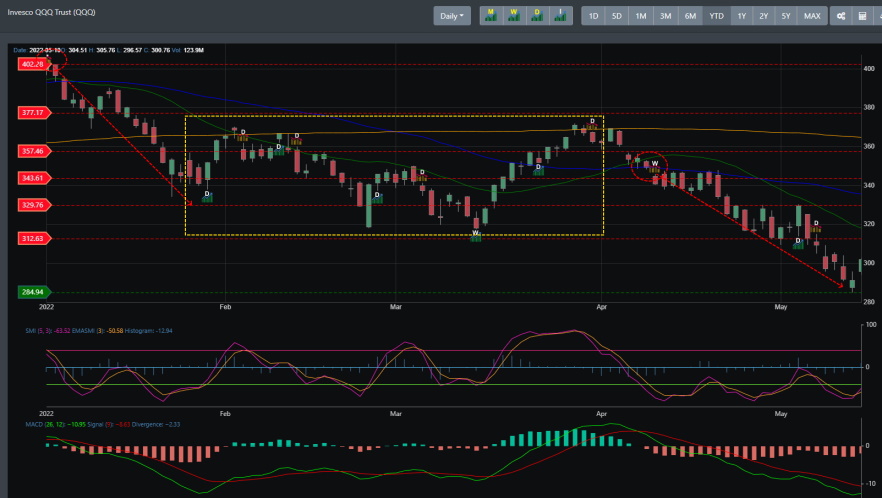
QQQ
On 1/3/2022, QQQ received a double whammy when both the monthly and weekly bearish readings were triggered. QQQ immediately corrected down into the 343 zone. A rally did trigger when the weekly bullish signal fired off on 3/14/2022. However, QQQ was unable to maintain momentum as another weekly bearish signal fired on 4/11/2022. Like SPY, QQQ had its lowest price reading on 5/12/2022.
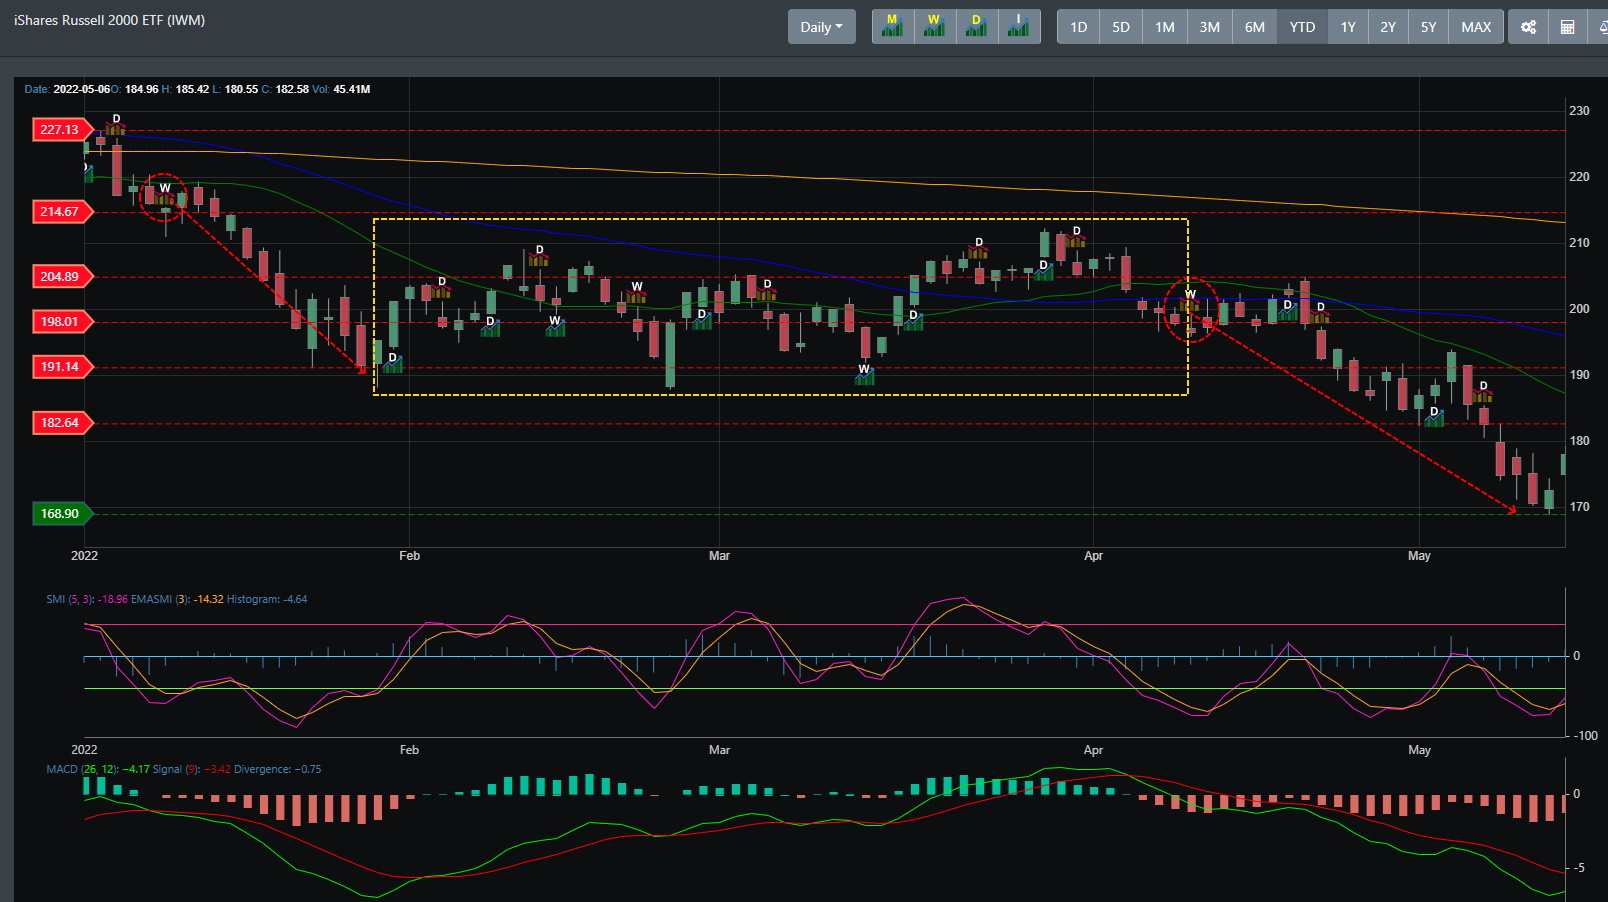
IWM
IWM's monthly bearish signal was triggered on 12/1/2021. A month earlier than both its counterparts SPY and QQQ. This was an early warning sign to the market that the larger time-frames were showing weakness. Though IWM has been consolidating in the 191 to 214 range for most of the year, it has since dropped down to a low point of 168 when its weekly bearish signal triggered on 4/11/22.
Concluding
The rout in April-May has dramatically reduced the overvaluation in many of today's stocks. With Friday's recent rally, has the bottom been struck? The near-term technical analysis suggests we still do not have any clear guidelines as to if the bottom is in. With the market rallying off the 3860 region and back above 4000, it will be important to see how this week plays out. This bearish sentiment has not been seen since the lows hit back in March 2020. Extremes such as this can be seen as a contrarian view that could potentially propel the market to new all-time highs. So, if the market can rally above 4085 and make a higher high to challenge the 4200 region, there is a case to be made that the bottom is in place.