


Are rising interest rates headwinds for financial markets? Or is it simply that the financial media have familiarized investors with the notion that financial markets decline when interest rates increase? This anecdotal fact has been compounded recently by the 2022 bear market and the surge in inflation. The suggestion that a higher interest rate correlates to a market decline does not hold well when we look back into memory lane.
Let's look at the 1990s and the period leading up to the bull market highs in 2000. The images below can be found on FRED, showing the Fed Fund Rate and Real Interest Rate from 1990 to today. Notice that the Fed Fund Rate and Real Interest Rates were much higher than they are today. Before the market crash in 2000, the Fed Funds Rates rose to +6.5% while the Real Interest Rates increased to above +3%. What did the stock market do at that time? The major indices rallied, with the S&P 500 +20%, Nasdaq +100%, and DIJA over +24%.
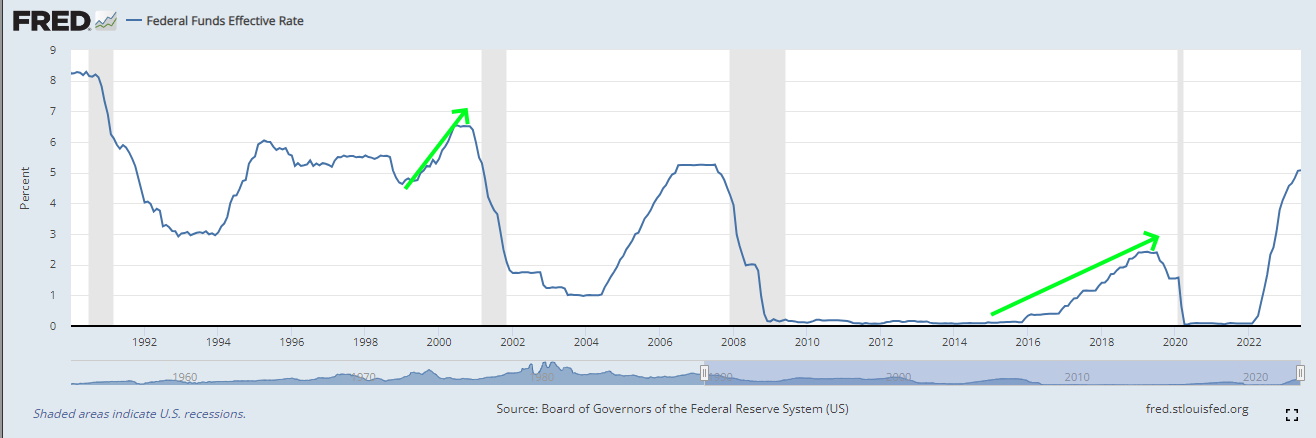
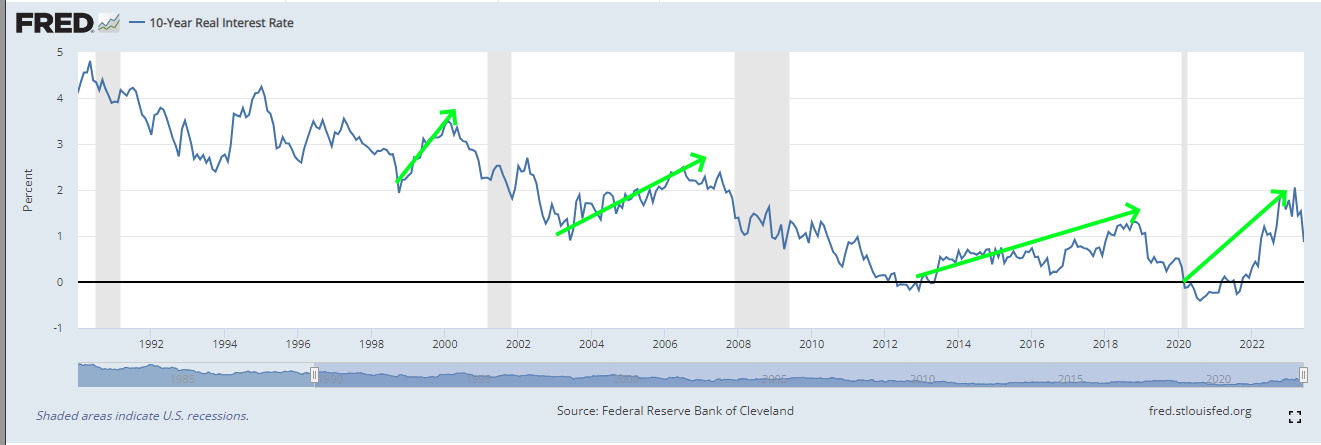
You can even look at the 10-year Treasury and find it was trading well over +4% during that period. Additionally, if you look at the periods where stock rallied over the last 20 years, you will find where we outline (green arrow) key areas of rising interest rates. During these periods, we also had market rallies where higher highs were being made. So, what gives? One potential element could lie in the fact that since late 2008, the Feds introduced Quantitative Easing (QE), which has conditioned investors into believing that higher elevation in rates will subdue the markets.
However, that was not the case back then, nor was it when we called for a bull market rally to begin last October 2022 in our blog, A Contrarian bounce coming. During that time, the Feds raised rates in September, November, and December (.75, .75, .50) while markets started their rally.
Big Picture
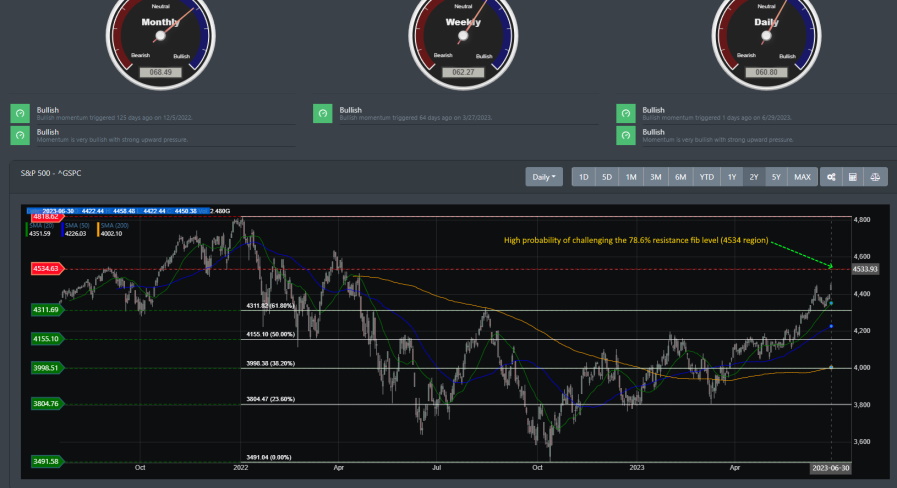
If you have not paid attention, U.S. financial markets have been in a strong rally since hitting their October lows in 2022. The S&P 500 is +15% YTD, Nasdaq is +31% YTD, and Dow was +3.75% YTD. 6 months ago, there was an air of pessimism that the current rally was a bear rally soon to implode on itself. That narrative has since changed, and investor sentiment has moved from fear to greed. FOMO is kicking in, and buy the dip gang is out in full force, as can be seen, evident in this weeks counter-rally. We can see just that in our big-picture view below of the markets. As we concluded in our last blog, we stated the following:
"Markets right now have a look of a topping. Whether that is a minor pullback will define how markets behave for the remainder of this year."
The market did pull back on June 16 to only bounce off of support near the 4311 regions. The S&P 500 is now poised to challenge its next resistance line.
Market Breadth
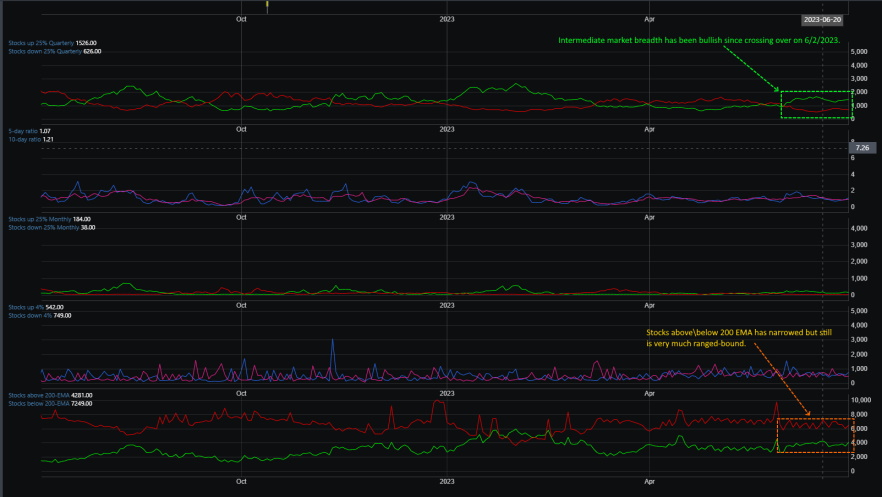
Market breadth on the near-term and intermediate timeline has been strong since our stocks, down 25% quarterly, crossed over to the bullish side on 5/2/23. Though a few mega-cap players have lifted this rally, there are indications that other stocks are now getting involved in the rally. This can be seen below from the indicator of stocks above\below their 200 EMA. The percentage of stocks below their 200 EMA has narrowed by the week.
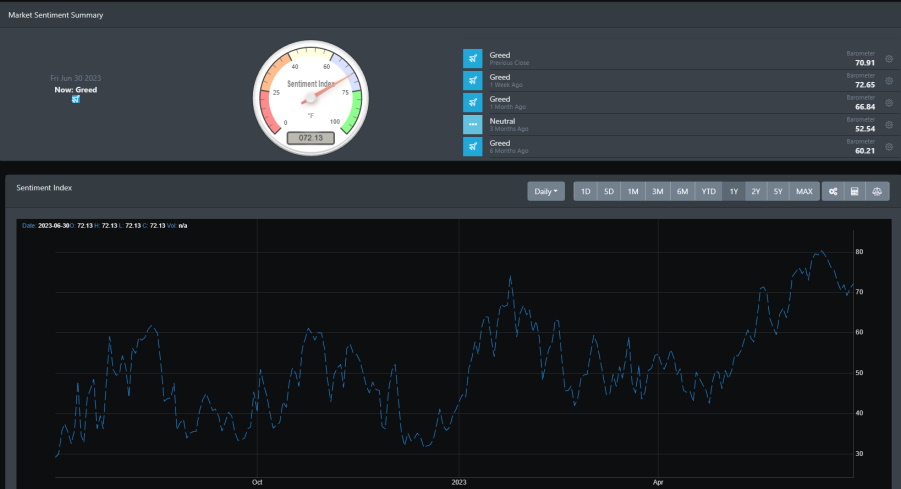
Market Sentiment
Investor sentiment, as defined by our BullGap market sentiment index, has been in full-blow FOMO mode. On 6/15/23, the gauge hit a near high of 80.42 before turning over temporarily. The last time sentiment was this elevated and for this duration was back in October\November 2021. At that time, markets rallied to all-time highs before giving way to the 2022 bear market. However, this pullback looks like profit-taking, with the dip buyers coming out in full force.
Market Outlook
The recent pullback has been corrective, with all major indices posting weekly gains. Additionally, other sector performances are now leading the charge. Semiconductor (SMH) and consumer discretionary (VCR) are now rallying, with safe-haven sectors such as consumer staples in the background for investors. This suggests broader participation in the rally.
We have been looking at the daily timeframe for the past few blogs. Today, we will take a step back and review the weekly timeframes. A bigger time frame allows us to zoom out and review price action where we can see the larger overarching moves of the market. We will also use our Trend Finder Strategy to assist in defining the trend from the weekly timeframe.
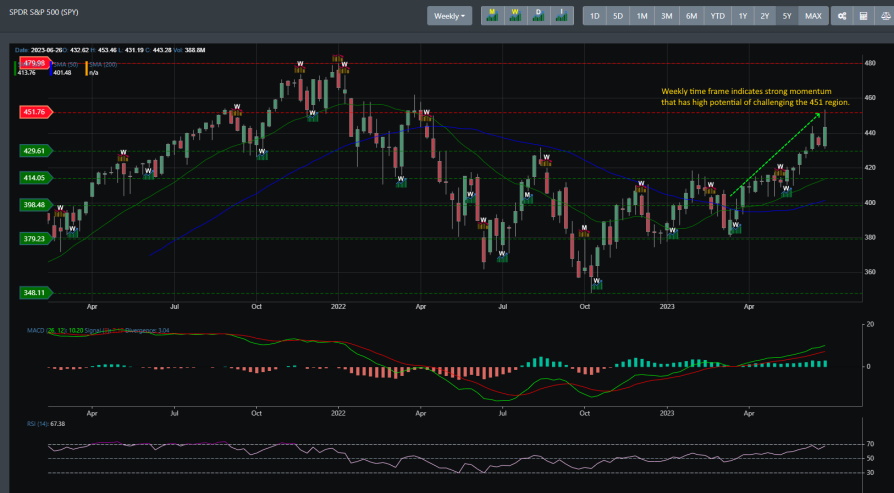
SPY
SPY is in a strong uptrend. SPY has recently broken through resistance at the 429.61 region, with the monthly and weekly bullish signal intact. This region is now acting as support, and though the SPY is overstretched technically, it still has an opportunity to challenge the next resistance at 451.76.
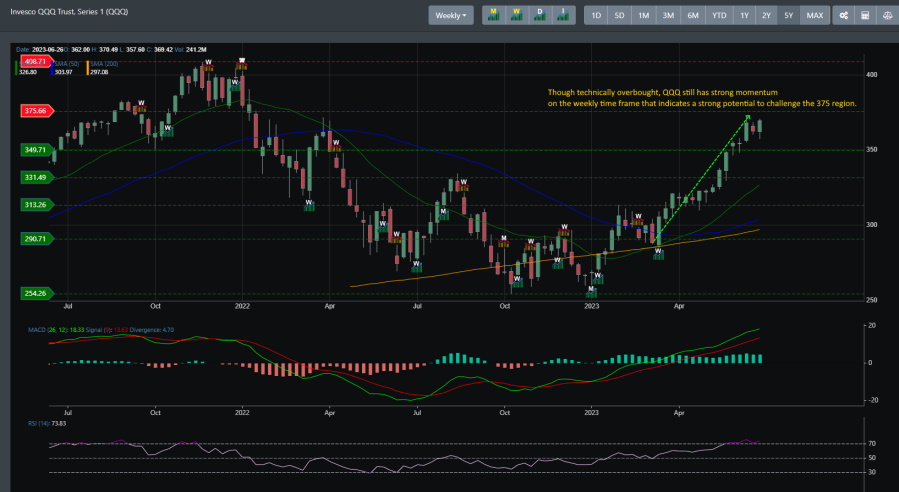
QQQ
Like SPY, QQQ is also in a strong uptrend. Both its monthly and weekly bullish signals are intact, and it is the clear performance winner for the first half of 2023.
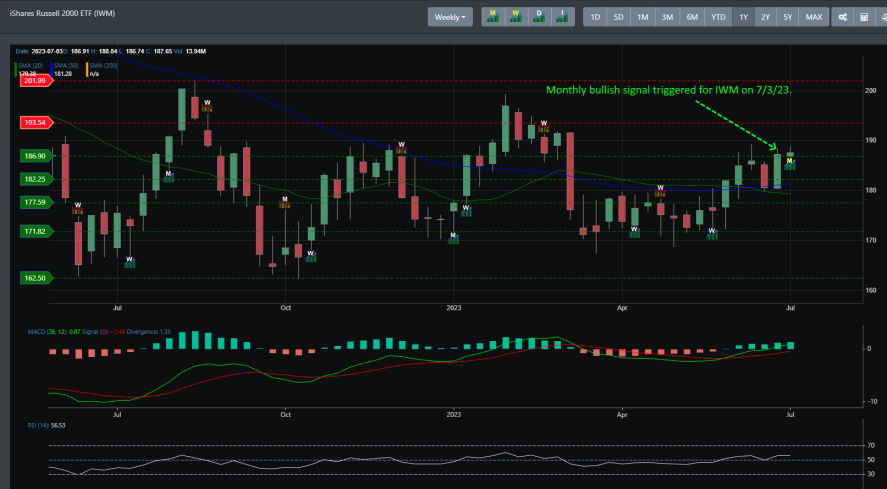
IWM
IWM led this week with a 4% gain to close out this week. But more importantly, IWM triggered a "potential" monthly buy signal for the start of July. This can be a game-changer if IWM continues to rally higher. As we discussed in our last blog, Now that is just bull; we stated the importance of small caps (IWM) being involved in the current rally.
"If IWM starts driving the market, this will provide equal balance, for now, heavy tech influence rally. It is still too early, and we are still waiting for the monthly buy signal from IWM. If IWM starts driving the market, this will provide equal balance, for now, heavy tech influence rally. It is too early, and we are still waiting for the monthly buy signal from IWM."
Concluding
Besides the strong technical picture, interesting data points are also making headlines this week. Consumer confidence came out with better-than-expected readings for the overall U.S. economy. Additionally, new home sales beat expectations with a +12% year-over-year increase - All this with the current financial tightening in the housing market.
All of this said, what is the expectation for U.S. markets moving forward? BullGap's quantitative and deep learning models now see a potential strong monthly momentum crossover to the bullish side in the coming weeks. Though the current rally is highly overextended, there are indications from our models that a monthly momentum bullish crossover will push markets into all-time highs in the coming 6 to 12-month period. Back in October of 2022, we had the weekly momentum indicator cross over to the bullish side, and with that, we called on the start of a new market rally. There is now a high probability that the monthly momentum index will also trigger. If IWM can start participating in the rally, it will aid in triggering the monthly momentum index into the bullish side.
Now, every strong rally requires healthy pullbacks to alleviate the overbought conditions. The current pullback so far has been corrective but did little to diminish the current overstretch condition in the markets. So, unless there is a strong break of support at the 4311 region and markets continue to buy the dip, the expectation is for markets to continue to rally and challenge the next resistance at the 4534 region.