


By now, we know about the drastic shift in the market. But are we on the precipice of another change, but this time going back up?
A little backstory. With its all-time high set in early January of 2022, the S&P 500 has fallen considerably on the year - 33% as of September 30, to be exact. Inflation has compounded the deficit, which in turn has put stress on the equity market. This has resulted in a loss of more than 12 trillion dollars in market cap. Those who bought into the S&P in 2020 saw a 20% return. Sounds like a good ROI? Not so fast. If you account for inflation, that 20% is closer to 5%, or a $1,000 investment yielding only a $53.20 return. Inflation has made investing in the equity market dismal. The wealth destruction is real for American homes as retirement savings and 401Ks lose out to inflation and the current bear market.
And not all is cut and dry. For example, many believe inflation has been the main driver of the market downtrend. However, last week was a reminder that the market pundits cannot put logic and reasoning into when and how the market moves. With Thursday's CPI report outlining that inflation was hotter than anticipated, many expected market participants to sell out and the U.S. market would plunge. While markets did drop during pre-market hours, many were left scratching their heads as markets rallied to almost 6% off of the lows.
Big Picture
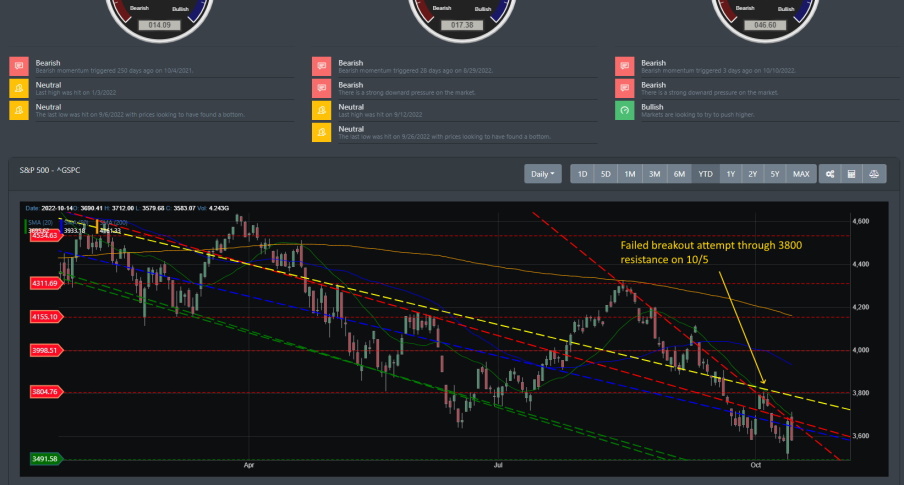
Our last blog touched on the "sell the dip" crowd taking over the bear market. This same crowd came in full force when a relief\counter rally kicked in on October 3. It brought prices up to our calculated support line near the 3804 region. Prices struck that high right on October 5 at 3806.91. However, once prices moved above resistance, the bears took command and brought the indices back down to a new low of 3491.58. This new low came right after the CPI report was issued on Thursday, October 13. With heavy short positions in hand, the bears got burned on Thursday as markets did drop to a new low but reversed course to soar for the day. While many market pundits were taken back by what happened on Thursday, it is a careful reminder that Mr. Market moves to a different beat. When market sentiment is near extremes, market participant reaction can usually change gears at a moment's notice.
Market Breadth
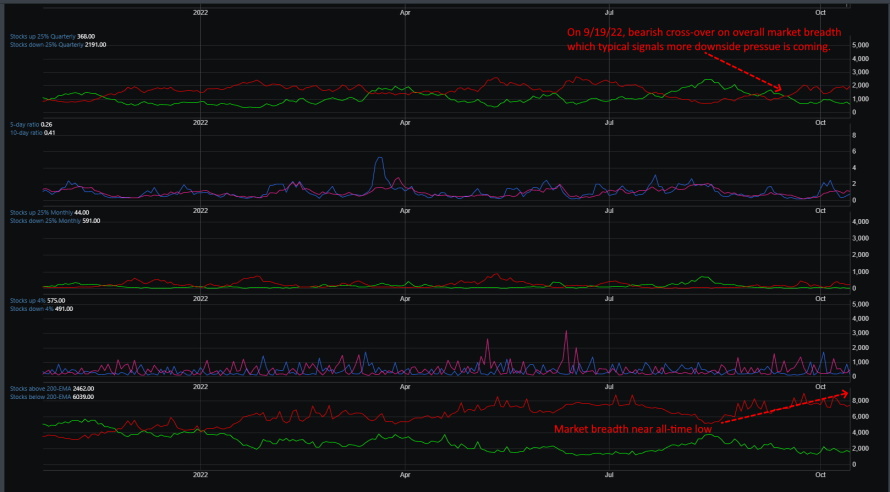
While our market breadth data has been trending bearish for most of the year, early October data show some improvements. The spread between the stocks up\down 25% quarterly has been slowly narrowing. Does this suggest a market rally is in place? Potentially. But the basis gap is still wide enough that it has placed markets in a limbo state where we are seeing market gyrations of short trend counter rallies which then sell out in short order.
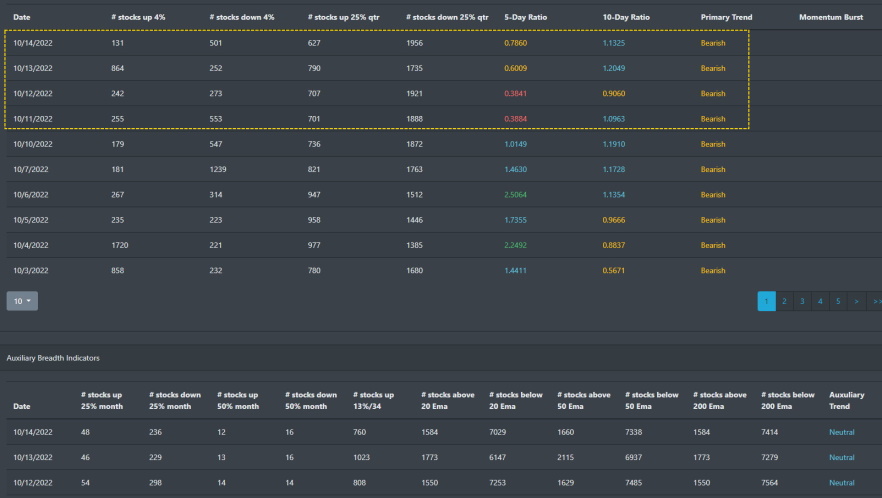
The auxiliary data for our market breadth, which tracks stocks above\below specific EMAs such as 25, 50, and 200, has been bearish since the start of the year. The number of stocks below their 200 EMA has been hovering over 90% for most of September and into October.
Market Sentiment
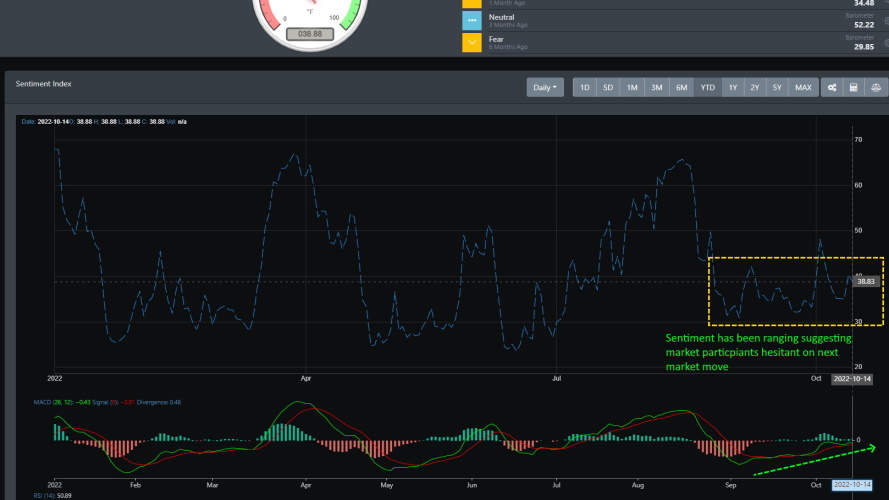
For much of the last month, sentiment has been ranging between the low 30s and high 30s. Historically, market volatility is the norm when the sentiment index ranges in this area. Sharp price movements in either direction are typical on daily time frames as well as the intraday. One silver lining from all of this is that the MACD for our sentiment index has been trending positive. With everyone bearish at the moment, this has a look of a contrarian move where markets will swing back up toward bullish in the not so distant future.
Market Outlook
Market participants headed into this week with a year-long of sellers and heavy put options. SPY had a put wall near the 348 level which the bears were hoping to cash out on. If markets dropped due to the CPI report, then the bears would have a field day on the bulls. Without any sound logic, the market did a reverse and markets soared to over 6% for the day. With markets moving higher, bears got burned and had to sell their short position and go long to cover their losses.
SPY
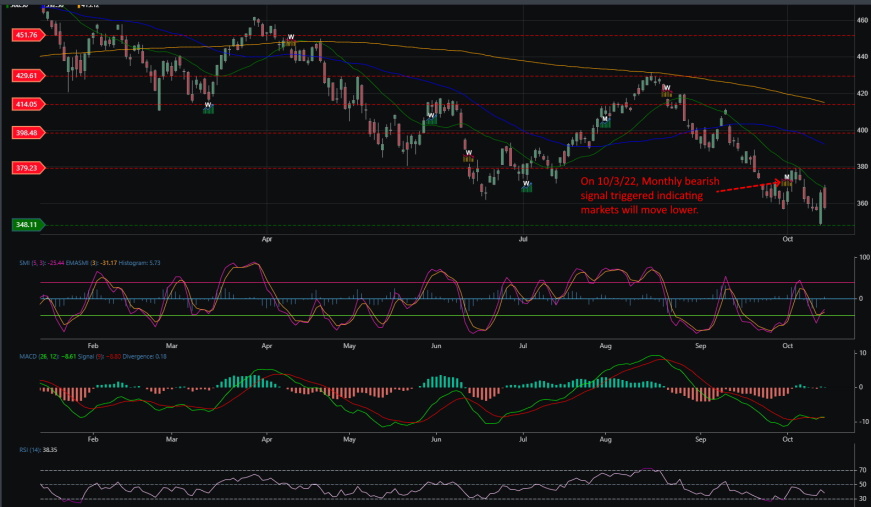
Looking at SPY on the daily time frame, we can see that a monthly bearish signal was triggered on October 3. A monthly bearish signal suggests strong downward pressure is hitting the market. Since this is a large time frame signal, there is a strong indication that the current rally for that week would most likely see more downward price movement. And a day after the signal was triggered, SPY reversed course and hit a new low at 348.11.
QQQ
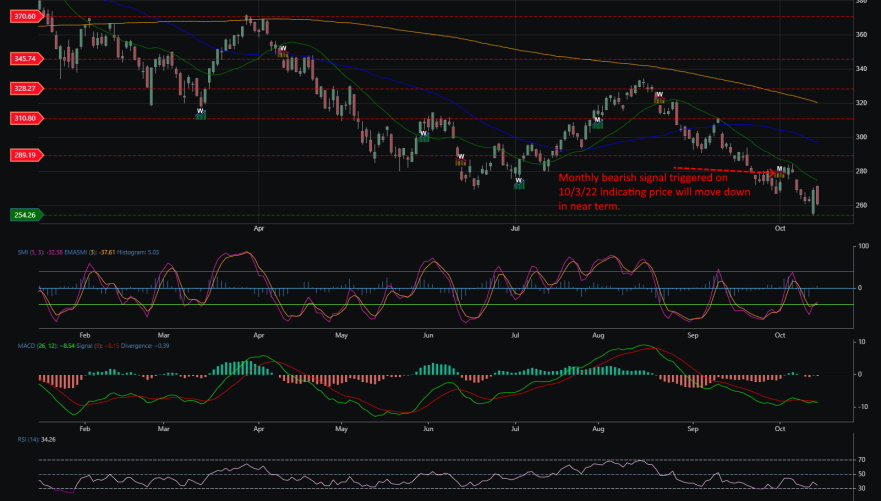
Like SPY, QQQ also was starting to look like it was beginning a counter rally on the week of October 3. However, with the monthly bearish signal triggering on that day, QQQ pushed lower to hit a new low at 254.26.
IWM
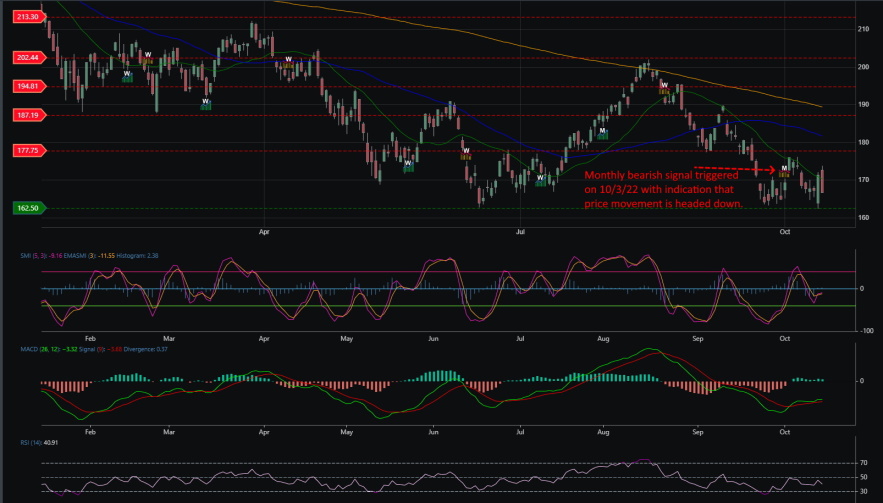
IWM also had its monthly bearish signal trigger on October 3. It also headed lower but was only a few basis points from its June low set on the 15th. With many calling for a recession to hit the U.S by next year, IWM has the look of a bottoming forming in the small-cap sector.
Concluding
With everyone bearish, is there a contrarian bounce in store for the markets? The CPI report indicating inflation is still hot did the opposite of what market analysts suspected. The market did precisely the opposite and rallied higher. Though the market sentiment is reading fear, the technical readings suggest a near-term bottoming is settling in. Additionally, when we look back at all major indices on the larger time frames, we can see that the weekly technical data suggests the same. IWM has not moved lower but has been sitting near support around its June lows. The current readings suggest that markets are placing in a near-term bottom, and a rally is forming. Whether that is short-lived or not is still to be determined.