


It is certainly hard to kill a bull market. Especially one that had begun back in back in 2009 and is still churning ever higher. While many financial analysts and market pundits were calling for a major crash for most of the year, we were stating back in December 2020 that we were expecting to see the S&P 500 hit the 4500 near the end of the year. Well, Mr. Market had a different mindset and hit that mark right before September of this year. With all the market fear news from market pundits stating that inflation, a market bubble, COVID variant, Fed tapering, and whatever else was going to bring down the market - it is still here making new highs.
This week alone, Mr. Market did something that has been rare to see. All major indices posted new highs for the week. With a 6% market dip to start in September, there was much market news calling for a deep correction. Anyone who got out in cash or tried to hedge the market probably found themselves on the wrong side of this rally.
Big Picture
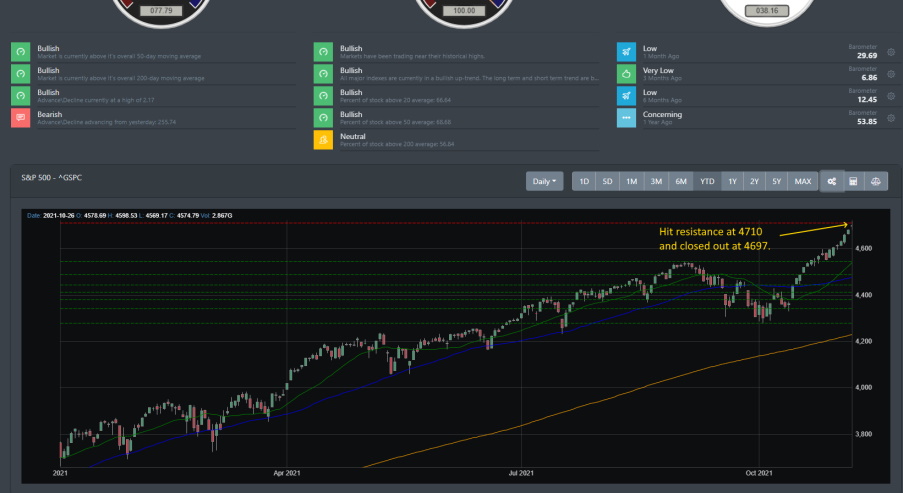
Markets came into this week with a strong performance from last week. Last week, markets did pause as the S&P 500 hit one of its key resistance at around 4350. This week the bull asserted its position as the S&P 500 posted 5 consecutive days of new highs. The DJIA made back-to-back highs and the Russell 2000 finally broke out for the first time this year. On Friday, the S&P 500 closed out the session having hit resistance at ~4710.
Market Breadth
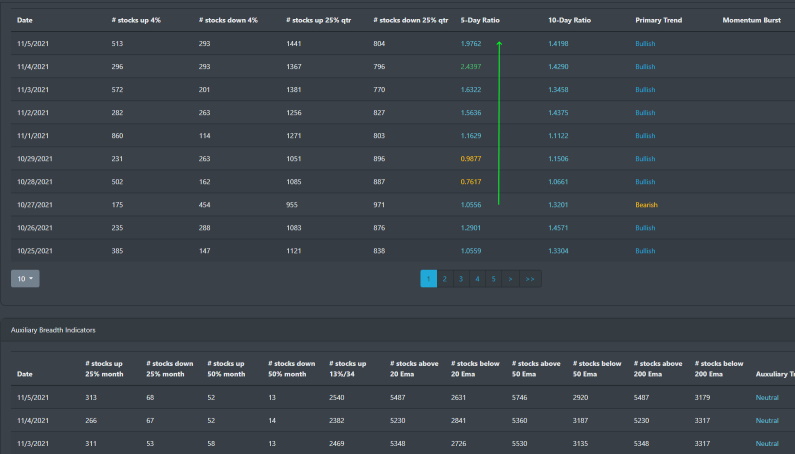
Coming into November, Market breadth has been gaining strength. The 5-day to 10-day ratio has been bullish for the past couple of weeks and # of stocks up 25% on the quarter has been increasing since being stagnant for most of September.
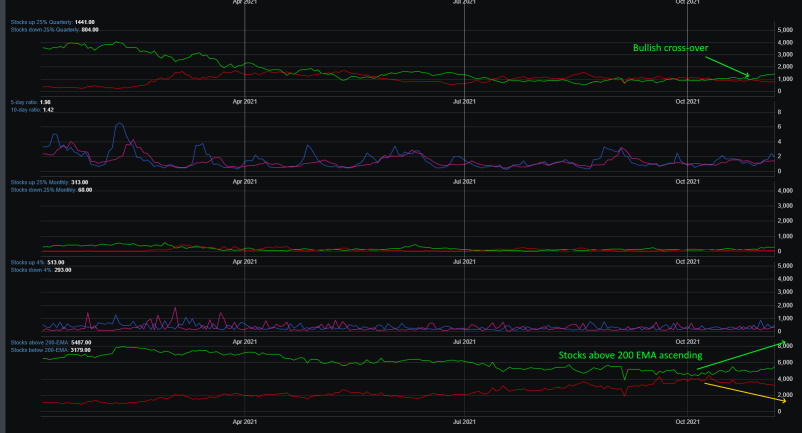
We can see that stocks above their 200 EMA have been declining for most of the year. Since the bullish crossover that occurred in mid-October, stocks trading above their 50 EMA and 200 EMA have started to climb upward.
Market Sentiment
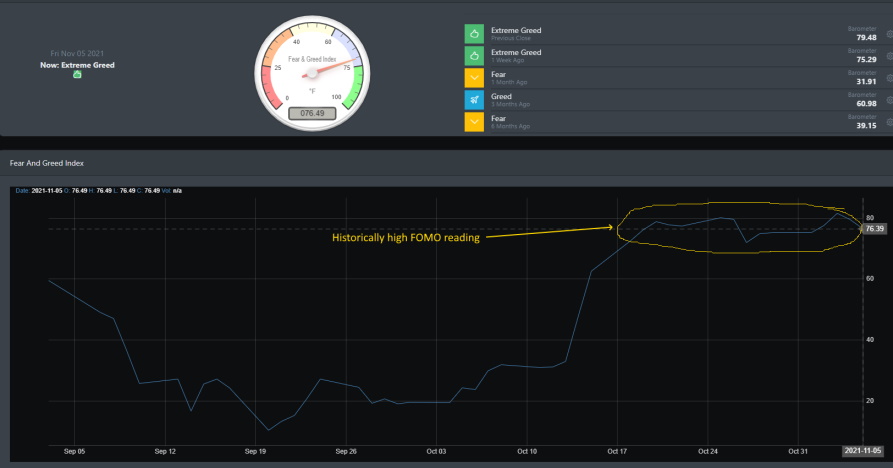
For the past 2 weeks, market sentiment has been in high FOMO. Irrational exuberance has not only kept the indicator at historically high levels but for such a long duration. Investors right now have a no fear mentality when it comes to the financial markets.
Economic Outlook
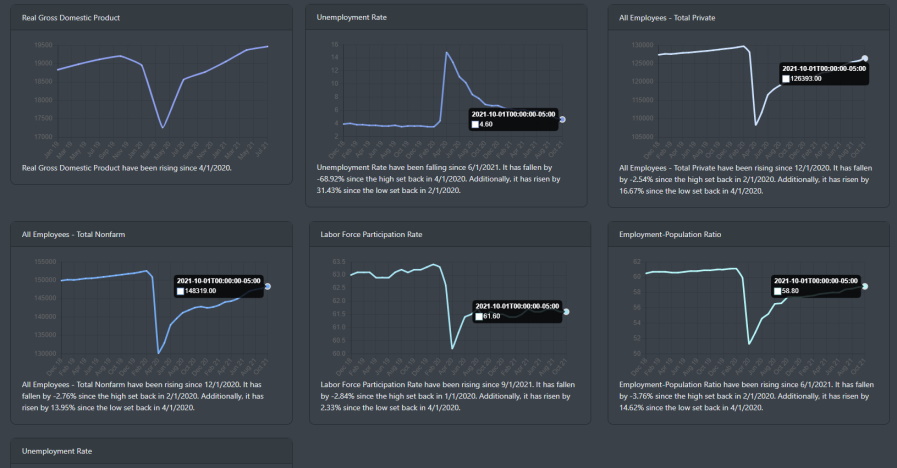
The big news for this week came out of the employment report. With the historically large number of jobs available versus the ability to fill them, the job gains for most of the fall have been short of forecast expectations. The October payroll report help paint a more positive note as nonfarm payrolls increased by 531K. Additionally, the unemployment rate inched lower to 4.6%. From the charts below, we can see that all employee for total private and total non-farm is trending up. However, one can see that labor participation is still well below the pre-pandemic level.
Market Outlook
The financial market is certainly having a strong week. While SPY and QQQ have been pushing higher for most of the year, small-caps have been in a consolidation pattern for most of the year. That all changed this week. Though technical readings are highly overbought and stretched, market breadth is showing signs of an upward trend.
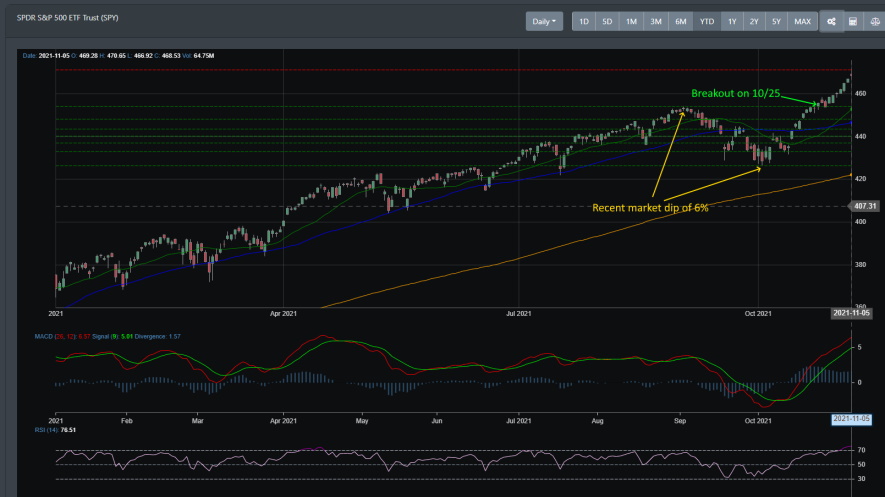
SPY
SPY had a breakout last week and then accelerated this week to close out at a major resistance line on Friday. Looking at the year-to-date chart for SPY, there have only been shallow market dips for most of the year. The most recent dip was right around 6%.
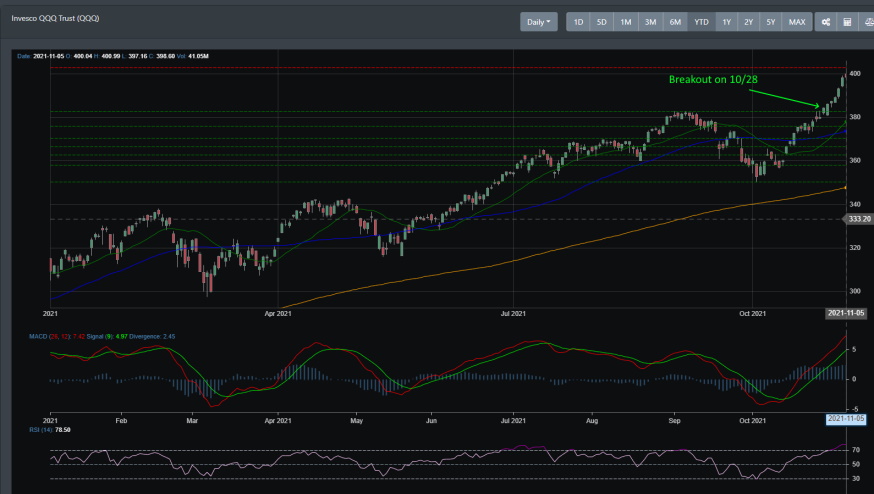
QQQ
Not to be outdone by SPY, QQQ followed up SPY's breakout a few days later and broke out of resistance on 10/28. It also has surged this week to near its resistance region. Looking at the year-to-date chart for QQQ, there have been some clear topping patterns. There were three this year. In February, May, and September. That said, it has been in a rally for most of the year.
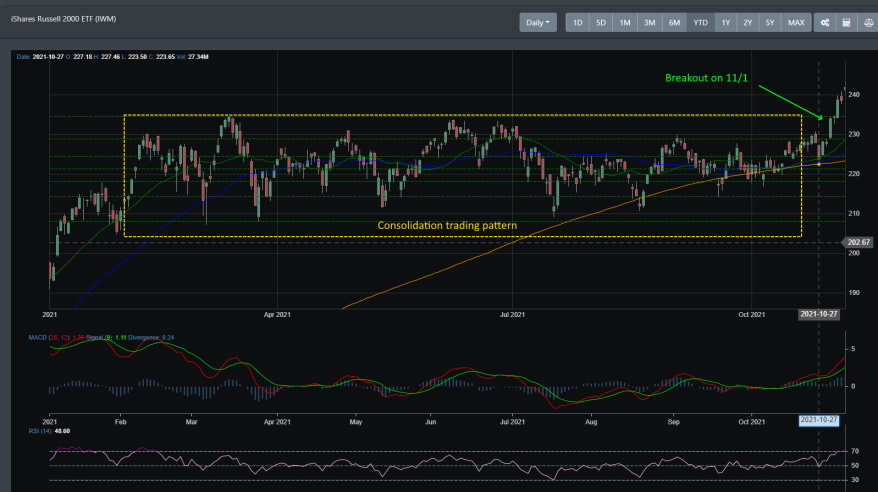
IWM
IWM broke out this week to the upside. On the year-to-date chart of IWM, we can see that it has been consolidating for most of the year. Having broken out during last November to lead the markets, this can be expected.
Concluding
It has been due time for the Russell 2000. It ripped up +6% for the week and is now up 24% for the year. It is right behind the S&P 500 for YTD performance. This may be an important turning point as IWM has been consolidating for most of the year. A break to the upside could indicate strong momentum is brewing for the markets. This coincides with our technical readings that the market will have a melt-up to the near 5000 regions in the next coming months. That said, markets closed out Friday are right up at resistance. If the S&P 500 is unable to break out of the 4710 regions, then this sets up for a high probability that we see a dip for the week.