


Stocks finished Q121 with head whipping volatility and concerns over market bubbles, market correction, and inflation worries. We discussed a few of it already in our prior blogs. With all the headline noise, there is still a simple fact in the market right now. The S&P 500 has gained over 5.5% for the first quarter and on the backs of tech, it hit its 4000 marker to close out the week. For the past year, pundits were calling for a market top, market bubble, euphoria that would send the market crashing. That has not materialized and as we discussed in our last blog, the market did have some dips along the way. That is normal in a bull market as prices just do not go up every day but follow a cycle. For the past 6 months, there have been 4 to 5 pullbacks recently and each one has been narrower and the preceding one.
Additionally, other indexes such as the Russell 2000 rose 12% in this quarter alone. Small caps is now currently in a consolidation period after rallying over 25% in Q420. The rotation trade is very much alive as investors moved into value trading (DOW) as the economy begins to reopen. All in all, we are very much still in a Bull Market that began back in 2009.
Big Picture
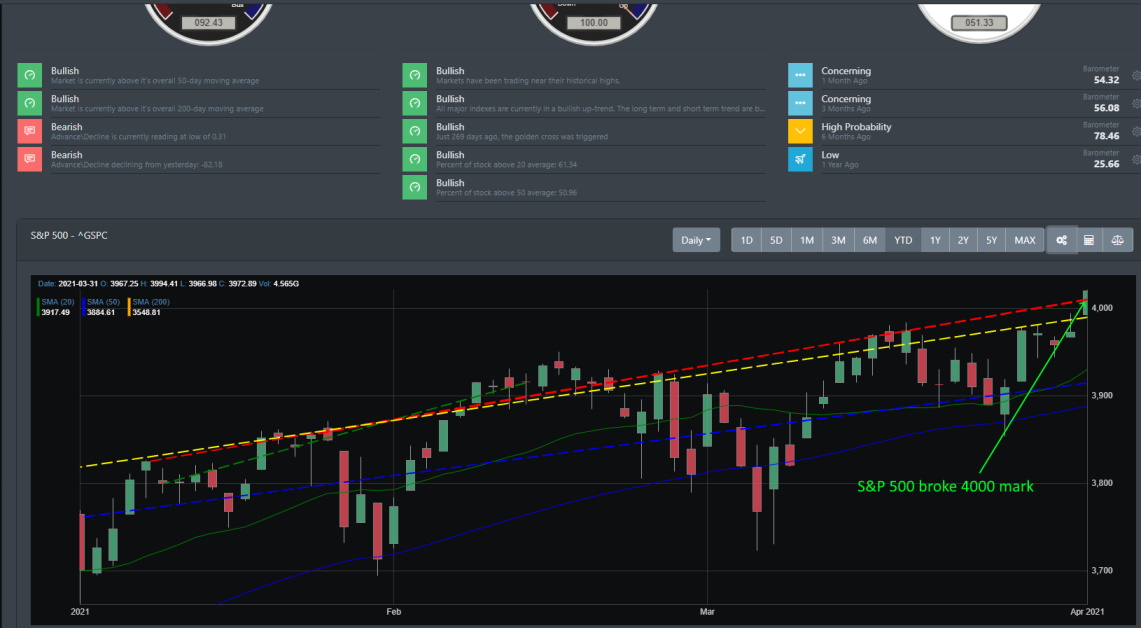
With a shortened trading week, the S&P 500 made the most of it as it pushed past the 4000 markers for the first time. On the chart below, we can see that on Thursday 4/1, the market broke through resistance to close out the week. At the moment, S&P 500 is trading nearly 22 times its forward earnings and is at the highest level in over a decade. This could be troublesome but with positive Q121 earnings, this has helped push the market even higher.
Market Breadth Table
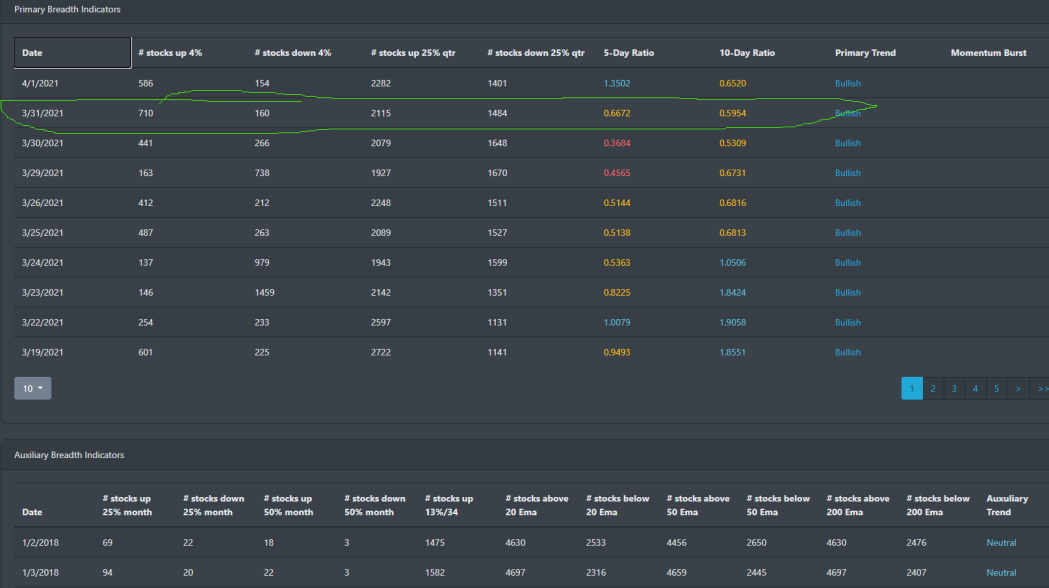
Early in the week, the market was clearly headed in different directions. The Dow picked up its 16th all-time new high on Monday while the S&P 500, Nasdaq, and Russell 2000 struggle to hold support until Wednesday. We can see that whipsaw in the table below as the overall market was in red on the 5-day ratio but with a strong reversal from the Russell and Nasdaq, it helps deliver a bullish crossover signal on Thursday.
Market Breadth Chart
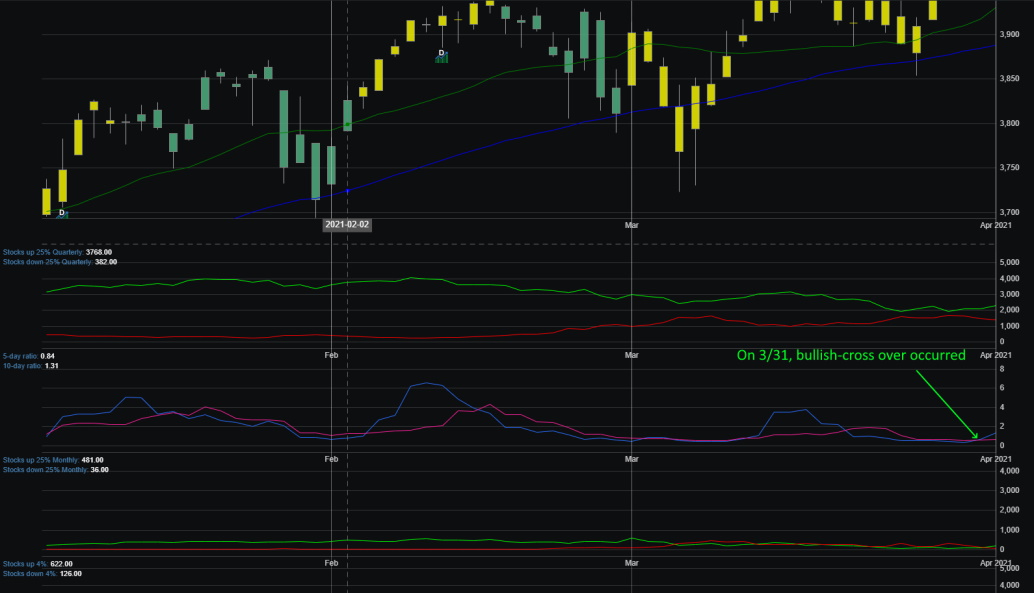
The percentage of stocks trading above their 200 EMA is staggering. Even with the recent market correction, there is a large percentage of stocks that are above their 200 DMA and EMA which suggest that the market is strong and broad.
Market Sentiment
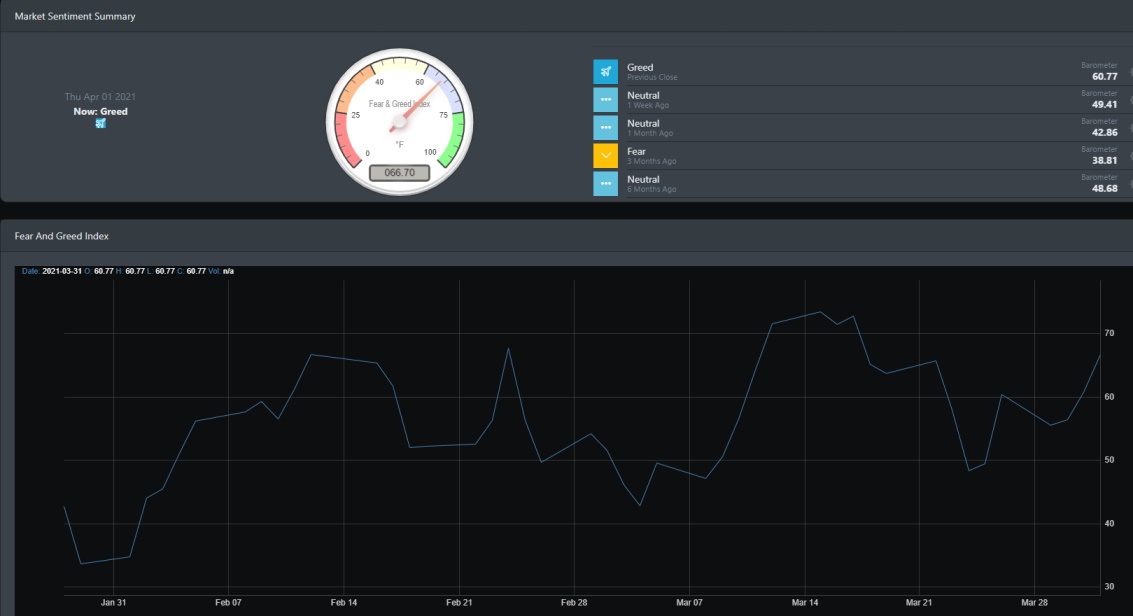
This week started off with some volatility for the market but mid-week saw a reversal in the Nasdaq that helped propel the bull market case further. Market sentiment is extremely high as evident in the chart below. It is currently reading 66.70 which historically foretells a drop in the market in the next few days. With the highest market being set at 73.43 back on 3/15/21 and with recent technicals issuing buy signals, we could see that high being re-tested in the coming days before a drop ensues.
Economic Outlook
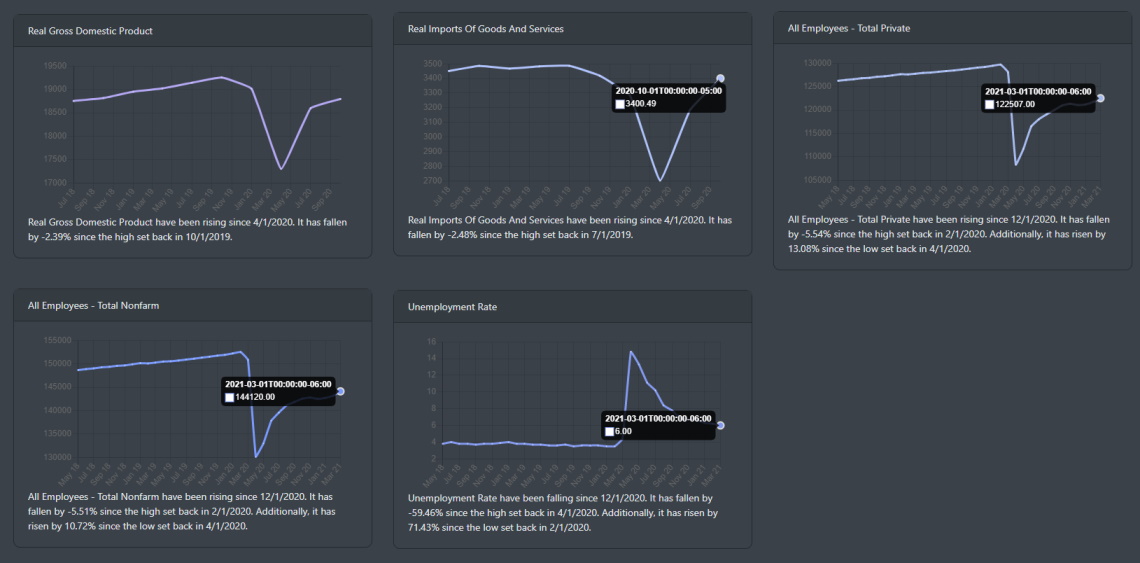
The big headline on Friday was the Employment Report. The Non-Farm payrolls report exceeded forecasts as jobs increased by 916,000. This helped to drop the unemployment rate down to 6%.
According to economists, jobs are expected to slowly make some traction for 2021. Payroll still will require some work.
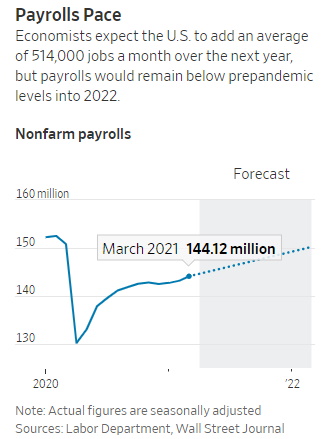
All employee's total private and nonfarm has been trending up. Though in reality, the labor market is still well below its pre-pandemic levels.
Market Outlook
This was a good week for the bull as recent BullGap buy signals are triggering a bullish move upward.
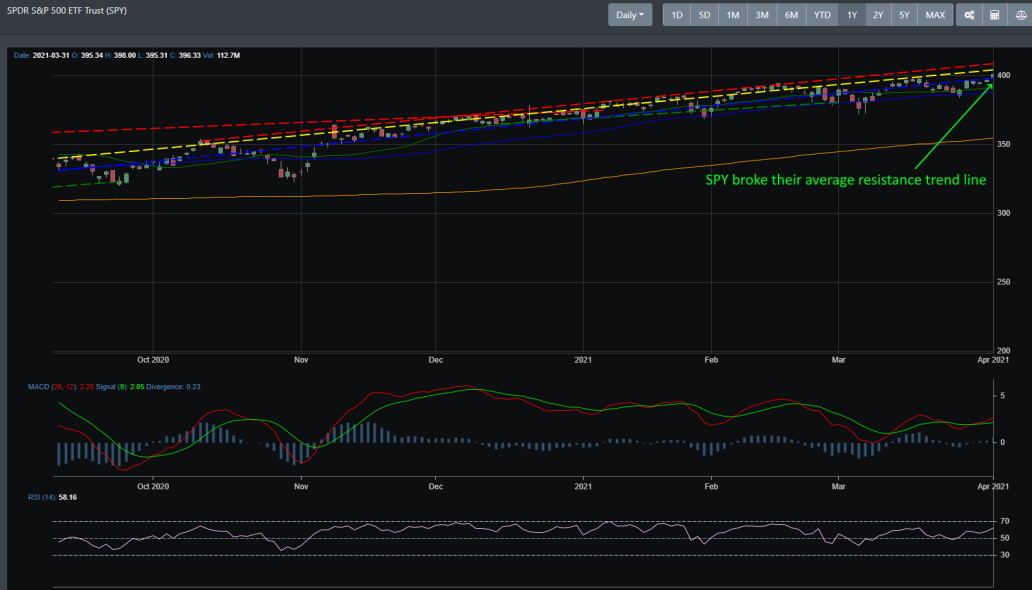
SPY
SPY has been on an uptrend for the better part of last year. Even with recent consolidation, it has finally broken through its average trend line. It could look to take on the next resistance level in a matter of a couple of weeks.
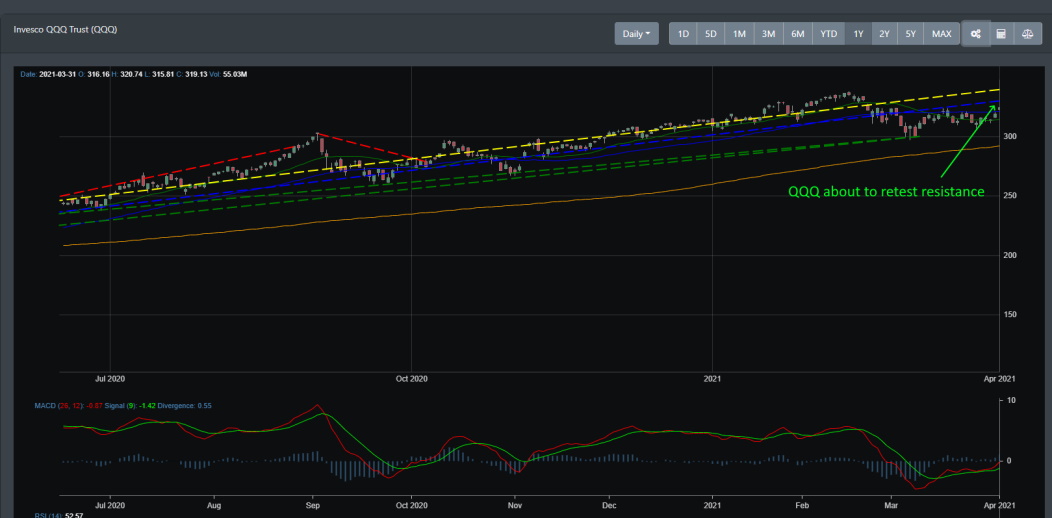
QQQ
In late February, QQQ broke its weekly trend and until recently it was mostly consolidating for the past month. Last Thursday, it hit key resistance but now looks to be ready to retest this level as early as this week.
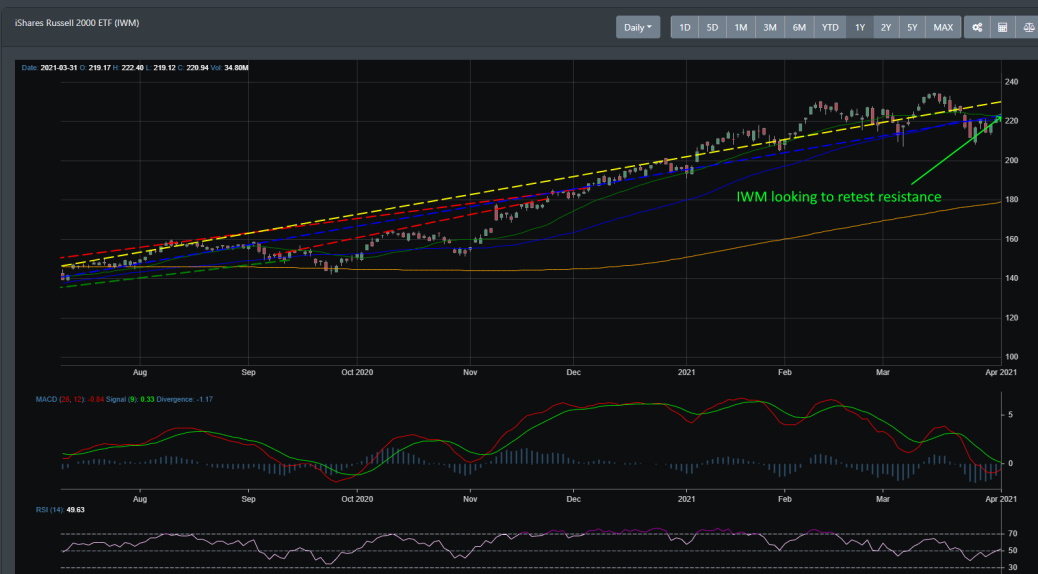
IWM
Like large-caps, small-caps also broke its weekly trend in late February. For the past month, it also has been consolidating. It is now poised to test key resistance levels.
Concluding
The economic reopening is underway and the macroeconomic backdrop has been positive. With continued Fed support, an uptick in the labor market, and possibly more Federal stimulus support, markets are poised for a strong second quarter. With BullGap's technicals issuing buy signals, April is looking to be a strong setup for the bulls.