


Seasonality is the name of the game here folks and for the S&P 500, this bolds well for the bulls come November. Typically, November through April is a time where the bulls take charge and this month is no different. Since coming out of the volatile September and October months, the S&P 500 has made a 9% advancement. Though this was definitely not smooth sailing as it has been a volatile few weeks.
Last week, Pfizer announced positive news on a vaccine which sent the market roaring higher. On that same day later, the market faded and now the markets are trading right around September's highs.
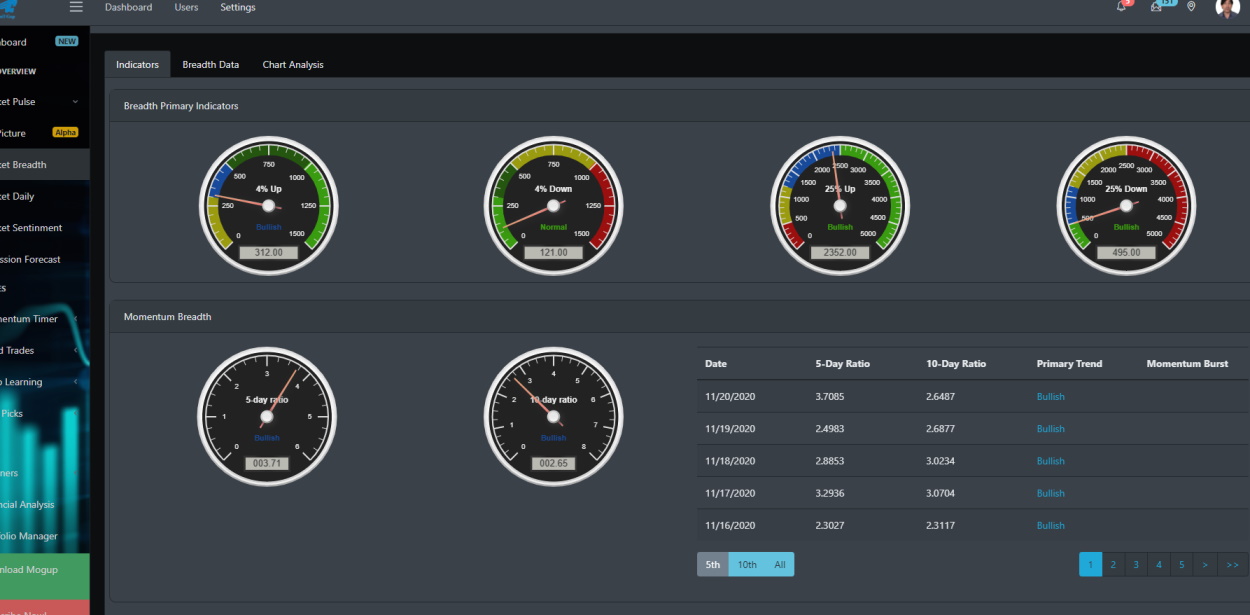
Big Picture Market Breadth
For the past few blogs, we have been looking at our reading on the Big Picture view. We are going to take a look today at Bullgap's market breadth readings. Ending on Friday 11/20/2020, the market is clearly in a bullish move. Though momentum has been volatile, the bullish 5-day and 10-day ratio of stocks up by 4% is reading a high indicator of 3.71 and 2.65. Typically, when the 10-day ratio for 4% daily hits above 2.0, that usually signals a bullish push.
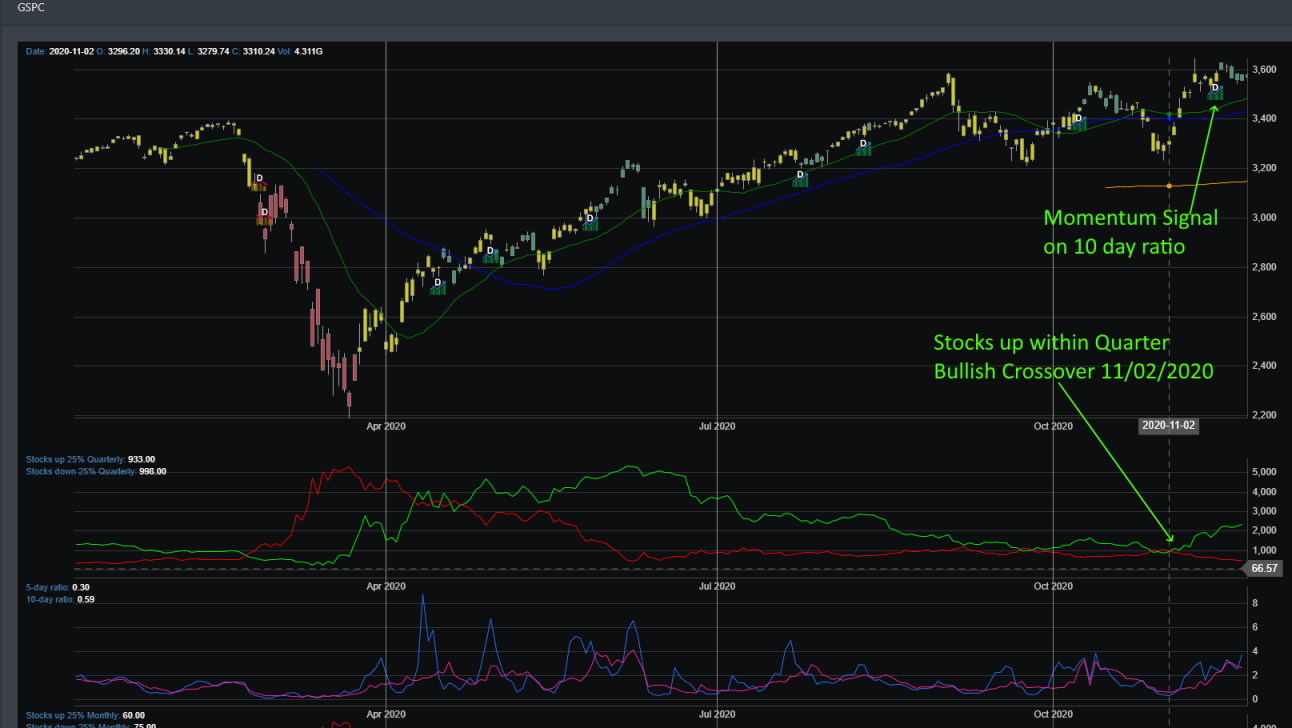
Market Breadth Chart
If we look at the breakdown from a chart perspective, we can see that on 11/2/2020, we saw a bullish cross-over in the number of stocks over 25% in a quarter. Historically, when this occurred, we see a momentum shift in favor of the bulls for the market. The last time this cross over going up was back on April 23, when we saw the unprecedented momentum in the market (just right after COVID-19 sent the market tumbling).
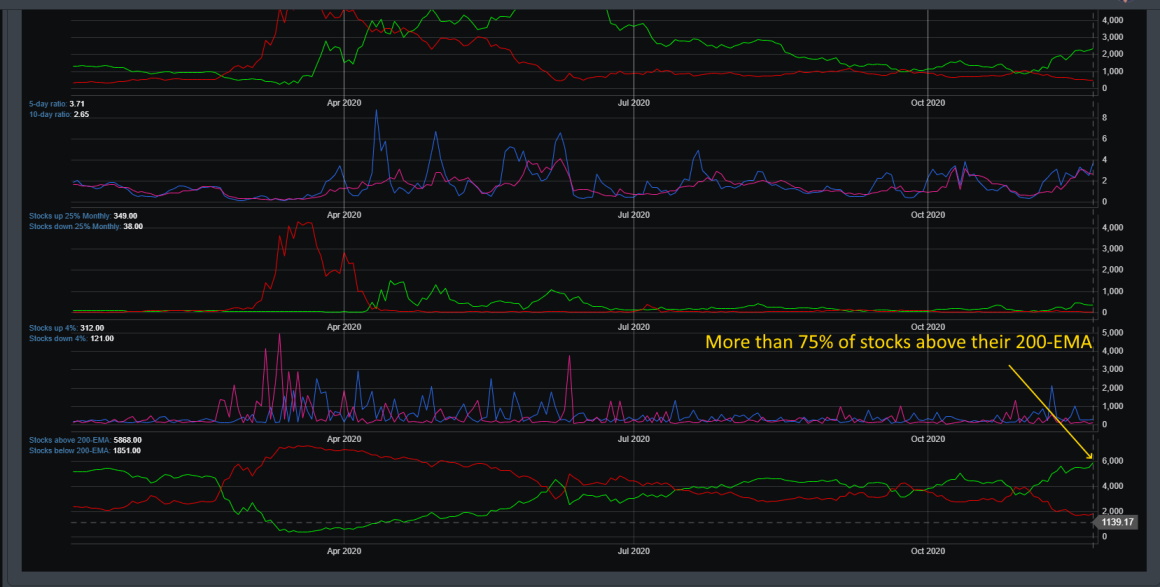
Worrisome sign
However, not all is rosy. The number of stocks now trading above their 200-EMA is at one of the highest levels we have seen in years. When markets get this overbought and encroaching at these levels, a short-term correction typically follows suits.
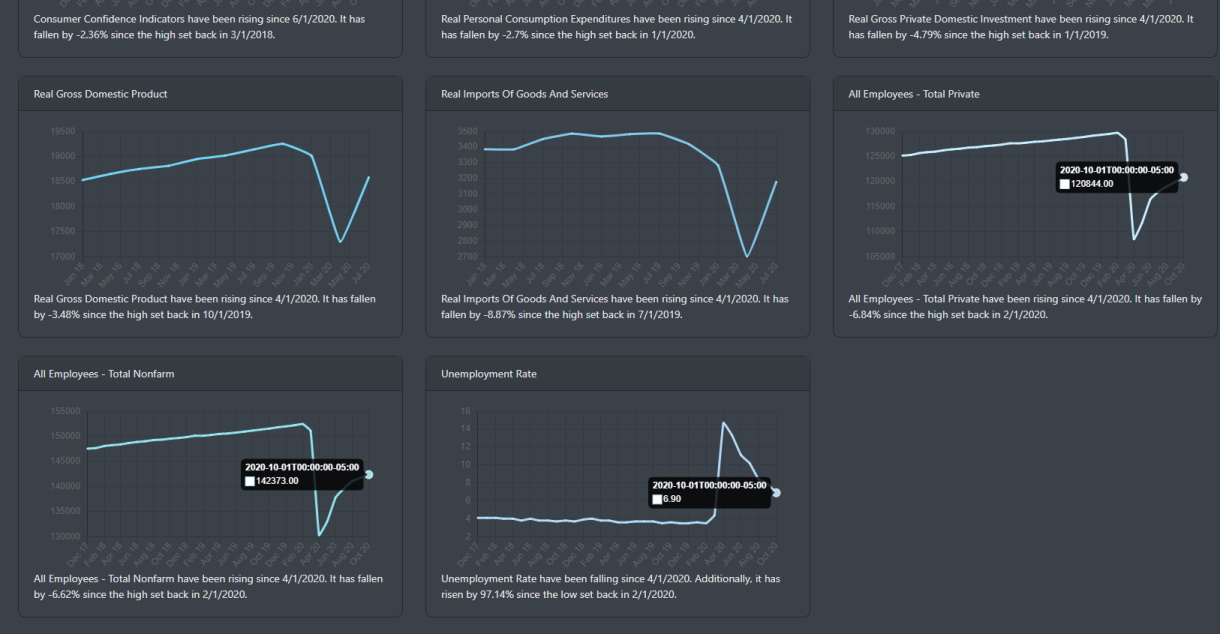
Economic Data
Outside of a continued rise in virus cases that may force additional shutdowns in December and July, the economic data is looking much better. You can read more about it in our prior blogs that focus on some of the key economic data that are making a V-shape recovery. The elephant in the room though is the labor market. Though initial and continued claims are declining, they are still at historic levels. Over 6 million people are still on continued claims.
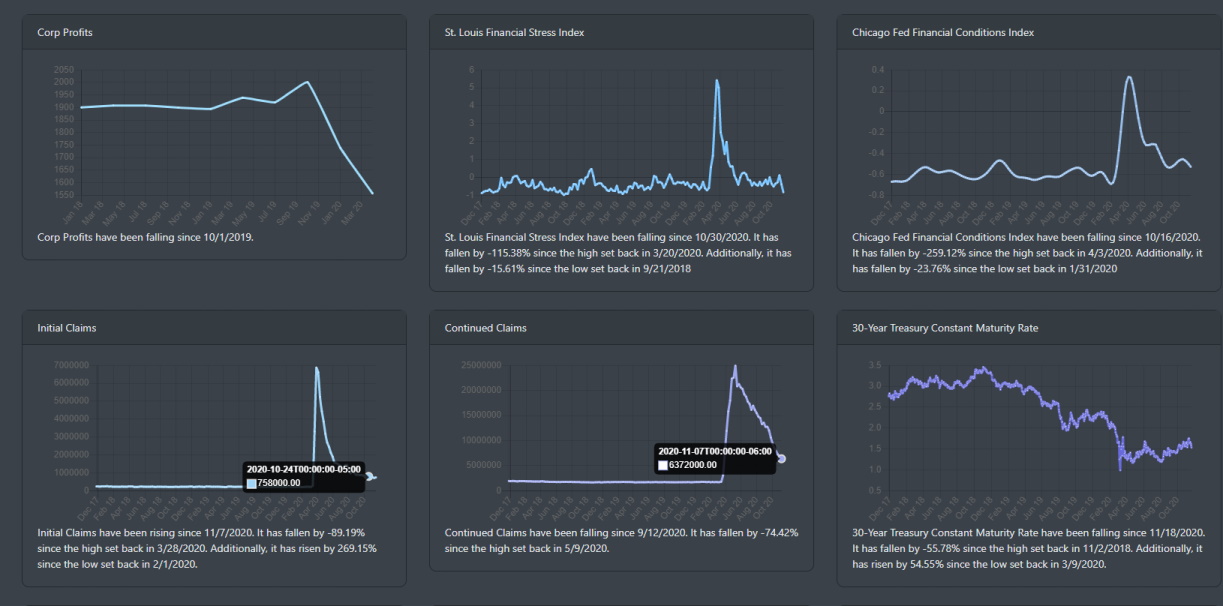
The unemployment rate is still high at 6.9% and the All Employees private and total nonfarm are showing a slow down in the hiring market.
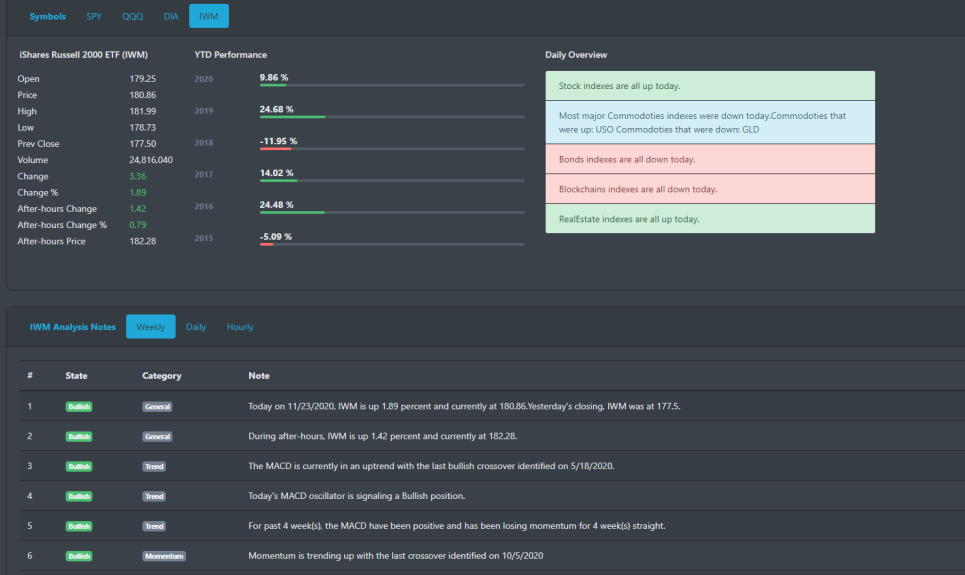
Market Daily
Looking at the market it is clear there is a shift going on between small and large-cap stocks. The Russell 2000 (IWM) finally hit all-time highs this month. When was the last time it recorded such a feat? Back in July 2018. The move this month has finally had the index in positive territory for the year. The weekly technical analysis readings for IWM is bullish across the board. QQQ gapped higher, traded lower, and then rallied for the rest of the afternoon. SPY was ranging for most of the day.
For the most part, it looks like SPY and QQQ are in a consolidation pattern while IWM is in a bullish trend.
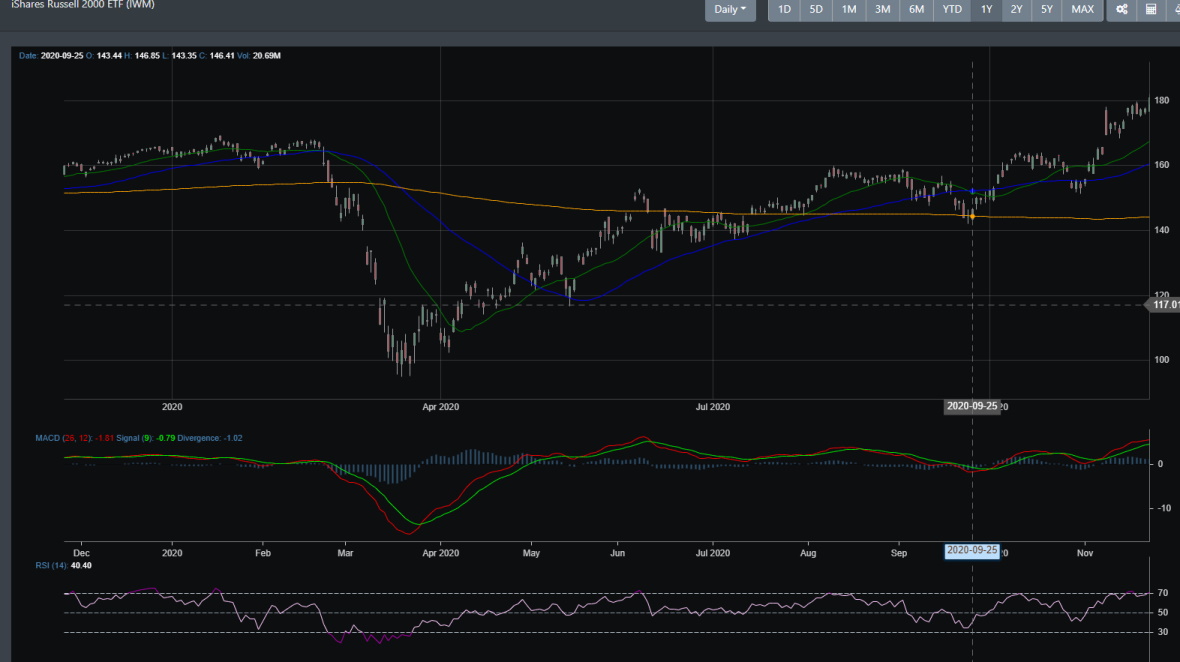
IWM gapped higher on Monday morning 11/23, consolidated some gains, and trended higher for the rest of the trading day.
Concluding
Though we did not cover it, Bullgap's market sentiment is currently in a neutral state but is reading 52.19 and in an uptrend. For the year, however, we are seeing sentiment at a very high level. Markets are incredibly exuberant and overextended. That said, momentum is currently on the side of the bull and November and December are usually on the side of the bulls. One thing to note. In early December, mutual fund managers must distribute their capital gains and interest for the year. With the lowest cash balances, there could be some selling pressure coming in early December.