


has definitely plagued investors this week. Like it or not, the markets are finding themselves in a period of indecision as the U.S election nears and talks of a stimulus package is put on hold. Corporate earnings last week are showing strong positive trends and companies are looking to raise guidance. While economic data is moving to the upside and earnings showing strong results for the week, the market seems to be more focused on the fiscal stimulus talks. It seems that for the past week any stimulus headline would either push or pull the intraday trading on the markets. The S&P 500 is currently oscillating between 3400 and 3500 and finding support on its 50 DMA. For the most part, the market didn't move much this week.
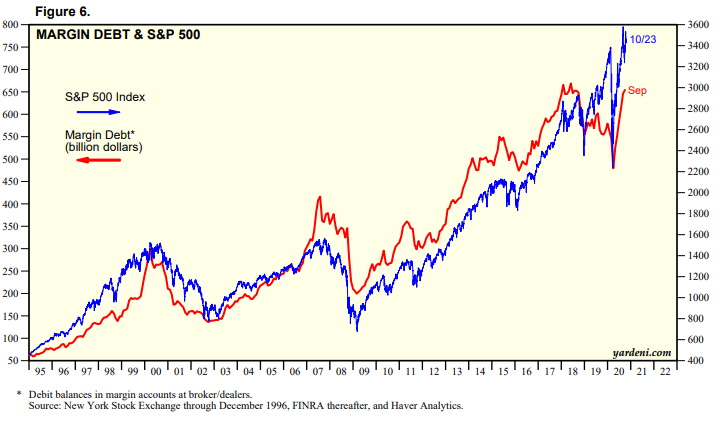
FINRA Margin Debt
Below is a picture of the S&P 500 and US margin debt (US Margin Debt source). Margin debt is the debit balance in security margin accounts. They are currently back at all-time highs. Margin debt hitting all-time highs usually indicates a bullish trend. However, if we look at the S&P 500 in blue below, there is usually a correction that occurs when Margin Debt peaks. We are venturing near the 2018 peaks as traders are turning more optimistic.
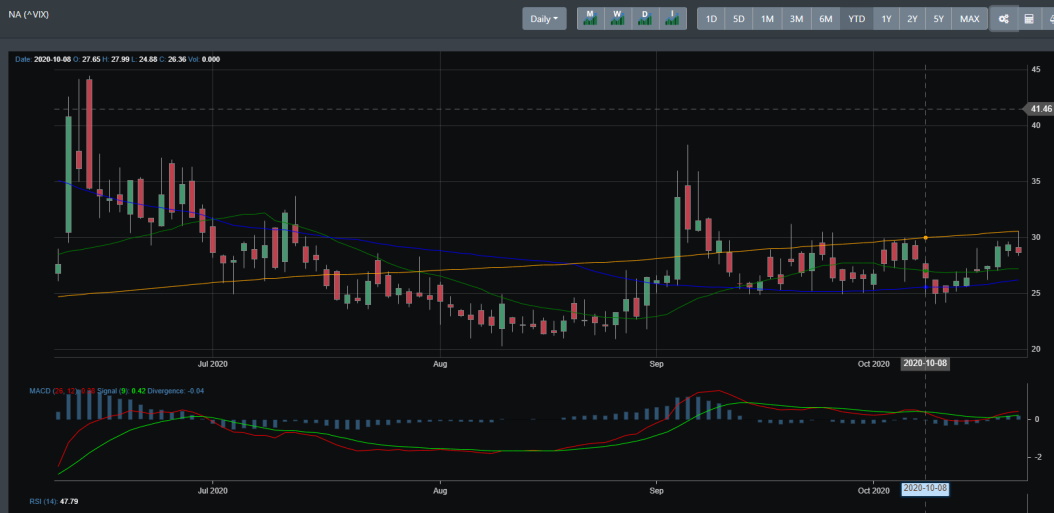
High volatility
Margin debt is reaching all-time highs again and what makes this more interesting is that it comes at a time of heightened volatility. Looking at the chart below, the VIX is near the 30-marker. For this year alone, the VIX has averaged around 30 which makes it one of the most volatile years in market history.
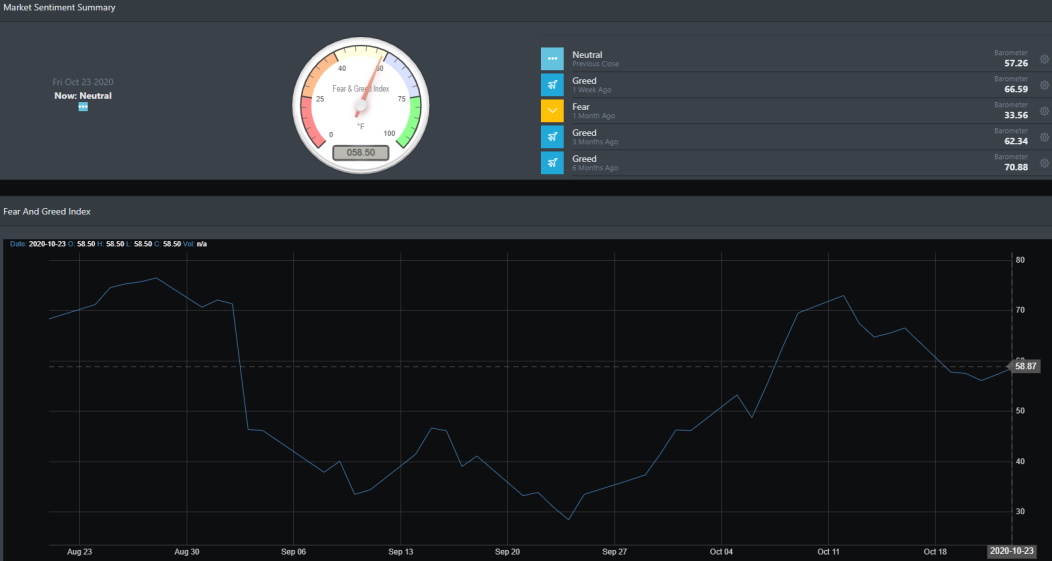
Market Sentiment
The market is grinding higher and traders are leveraging their accounts near 2018 levels. VIX is signaling elevated volatility but it looks like the market is getting greedy again. BullGap's market sentiment index is nearing a greed signal with the index reading 58.50.
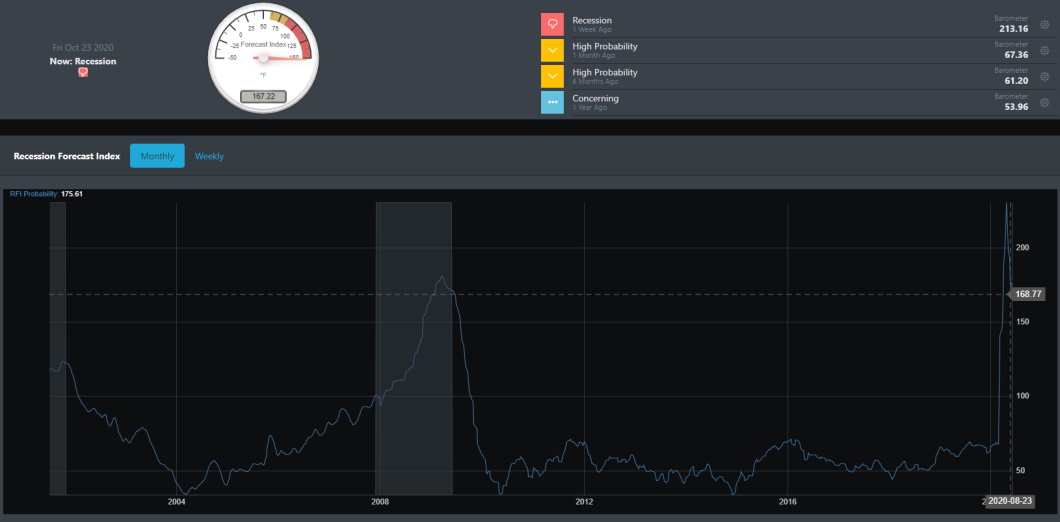
Economic Data
Let's start with the earning reports of 84 S&P 500 members. Total earnings are down -11.1% from last year. However, earning reports were good with over 80% beating EPS estimates and over 81% beating revenue estimates. With we look at BullGap's recession index below, it is clear that the economy is improving. With a high of 220+ during early April, the index has fallen to 167.22 (still highly elevated).
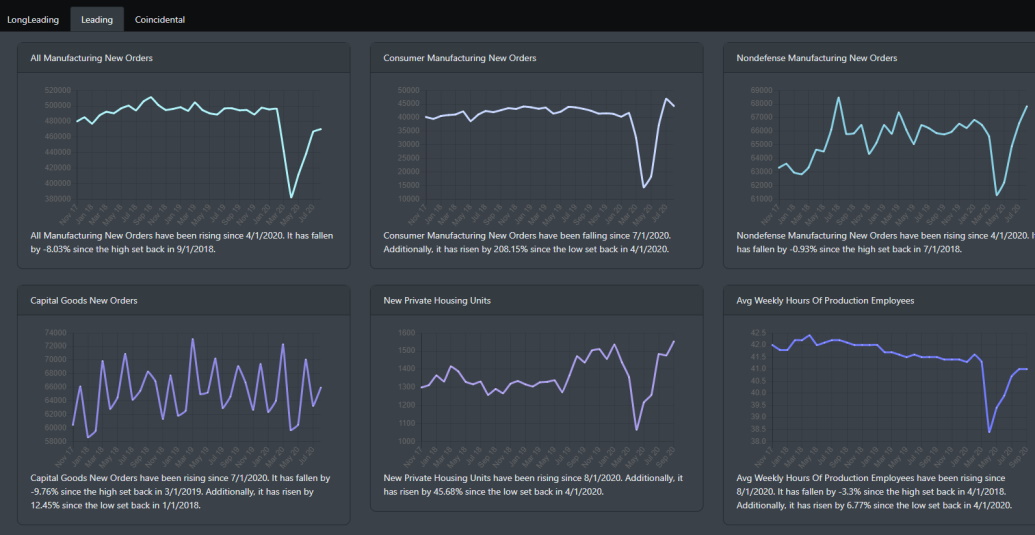
Leading Indicators
Taking a look at some of our leading indicators will suggest that the housing market and manufacturing is helping to pull the economy up. Consumer and Manufacturing new orders have already made a V-shape recovery and are above pre-lockdown highs. Likewise, new housing is also making a V-shape recovery. For the most part, most indicators bottomed about 4 months ago and have now since rebounded.
Market Readings
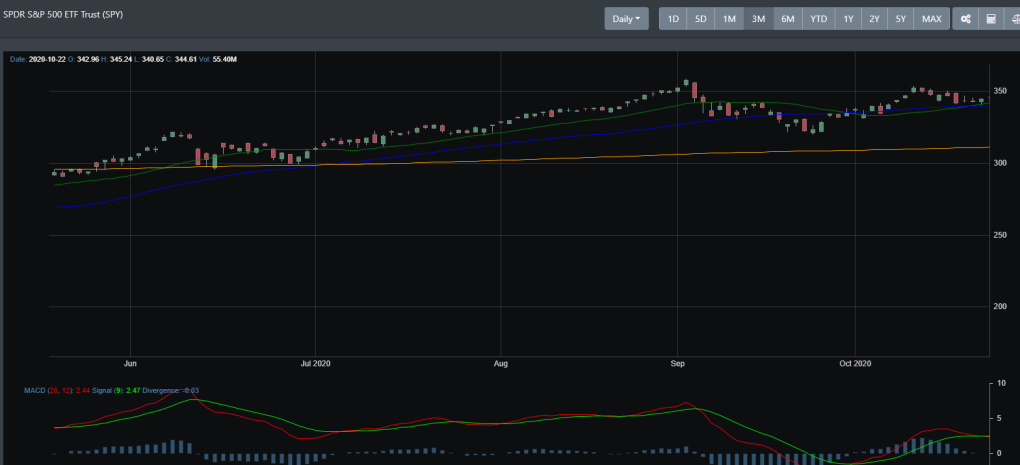
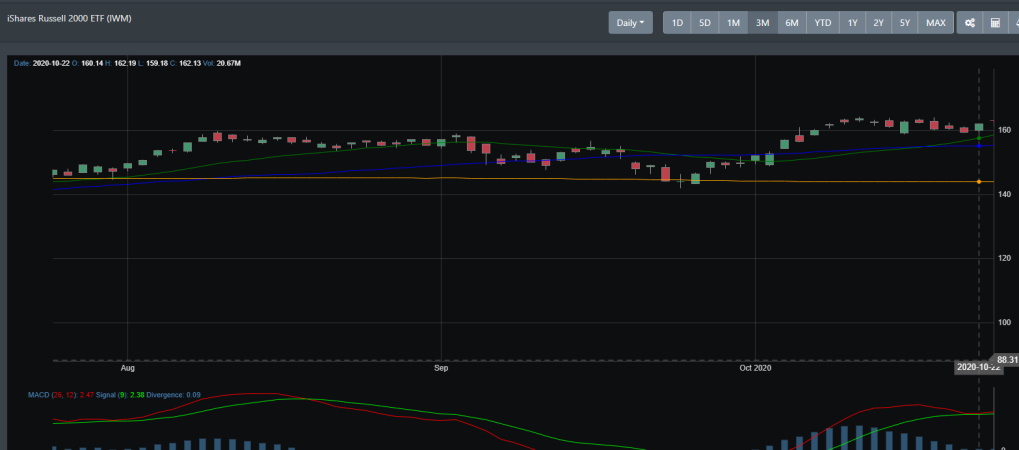
As discussed above, for the past couple of weeks, the market has been driven more on the hopes of a stimulus package. The election, COVID news, and economic data have kind of been on the wayside. With heightened volatility, the intraday swings for the week have been a roller coaster ride. For this week, only three equity indexes moved higher. Small-caps, Mid-caps, and transports. Large-cap QQQ had a 2.25 percent drop.
SPY for the most part traded within the range of 342 and 345.
IWM did well this week with a strong rally near the end of the week. This coincides with what we discussed earlier in this article regarding traders moving toward a more bullish position.
Conclusion
Markets did not do much this week and that may be a good thing. As discussed earlier, traders are leveraging their accounts to 2018 highs, buying into small caps and the market is moving toward euphoric optimism. While the news headlines are spitting dire economic downturn and COVID headlines, it seems that the market has already price that in. Or maybe the market just does not agree. Regardless of the confusing headlines, the housing market and retail sales are posting recorded numbers. It is clear that the market is moving toward a bullish trend. However, market deviation as discussed in our prior blogs is trading above 3x standard deviation. The markets are currently overextended and overbought with bullish optimism digging in.