


Technically a depression...
Or coming close to it. The steepest contraction in the U.S. economy since the Great Depression has just rung in for Q2 2020 (2Q20 GDP). Not surprisingly, real gross domestic product (GDP) fell at an annual rate of 32.9 percent in the second quarter. In the first quarter of 2020, real GDP decreased by 5.0 percent. Neither the Great Recession nor the Great Depression has put such a dramatic drain on the economy. Technically speaking, the United States is in a depression - depression is defined as an average GDP of negative 10% for the year.
In the time span of 3 months, the United States went from having a modest expansion to a severe depression that has far-reaching impacts. The likelihood that the U.S. GDP for all of 2020 will exhibit a 10% decline is looking highly probable.
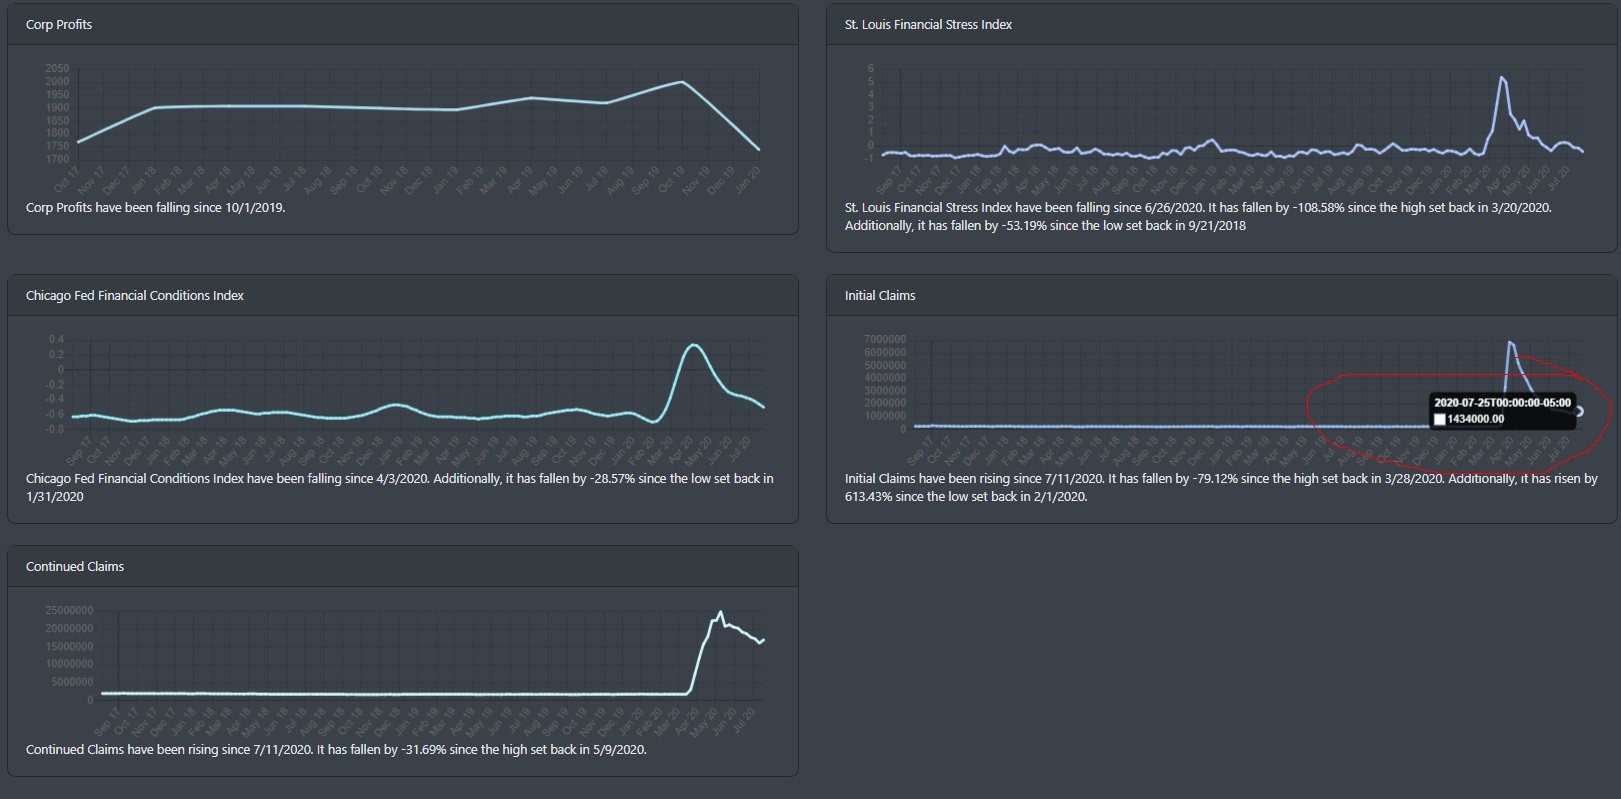
All major categories of spending such as personal consumption, private domestic investment, etc are showing massing drawdowns. Looking at BullGap's recession indicator below, we can see that the labor market is still hemorrhaging. The seasonally adjusted initial claims were at 1,434,000 on July 25, 2020. That is an increase in 12,000 from the prior week. Additionally, on July 18, 2020, continued claims (those still receiving unemployment benefits) rose to 17,018,000. Businesses are trying to re-open and COVID-19 is just stalling the re-opening.
Market Psychology
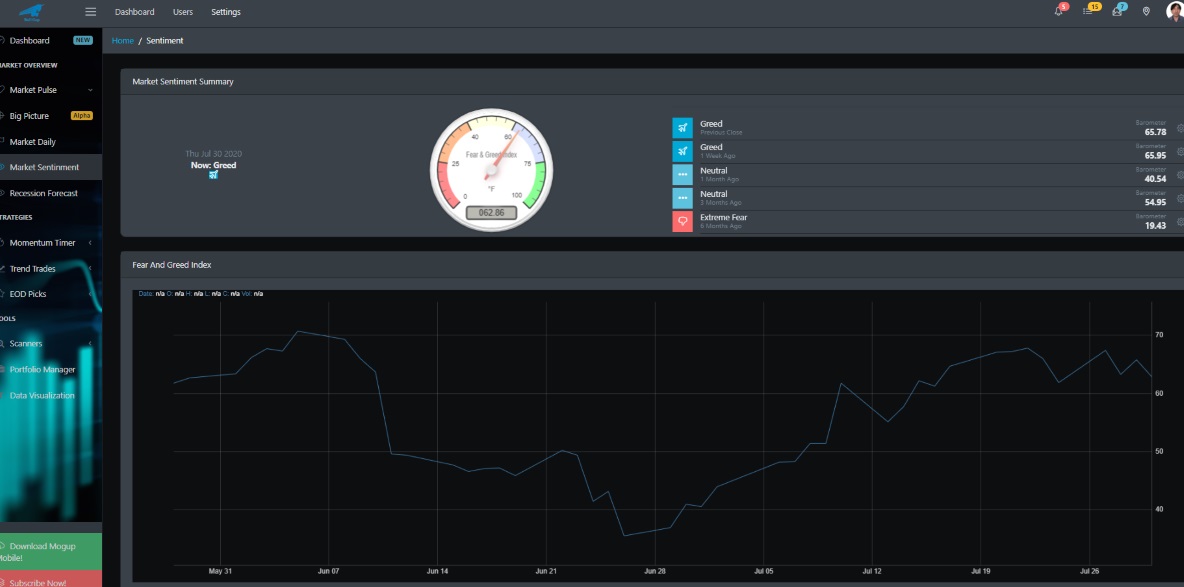
As discussed several months ago in our prior blog, there is a real disconnect between Wall Street and Main Street. Despite the fact that the economic devastation is clear, investors are currently bullish. BullGap's market sentiment indicator has been reading bullish for the past 2 weeks. This reading suggests that investors are currently very optimistic about future returns. When we look back at our Market sentiment data for February's deep sell-off and June's high, the sentiment reading was similar. At these levels, it usually can be interpreted as a "contrarian" indicator. Investors seem to be heavily invested in equities and this contrarian condition may move the market to a short-term sell-off.
Big Picture Breadth
A bull market rally is considered strong when all the participants in the market are moving in that similar upward movement. When looking at the data, this does not seem to be the case. Low volume and weak security participation have led to the mid-June to July consolidation that we have been seeing. If we look at BullGap's Big Picture analysis below, we can see that the current rally is only being pulled by a few strong stocks. MSFT, AAPL, GOOGLE, etc.
Only 45 percent of stocks in the S&P 500 are above their 200 daily moving averages(DMA). A strong bull market is typically broad and should have at least 60% of stocks holding above their 200 DMA.

The Contrarian Signal
This is a market indicator that is known as the "contrarian signal". This market indicator signals the opposite of what one might intuitively conclude from the signal itself. One such market indicator is the "dumb money confidence index". Dumb money equates to individual retail investors. Whereas smart money is referred to as institutional or hedge fund investors.
The contrarian viewpoint is as follows. If everyone is bullish on the market, then all of the individuals who could be buying securities in the stock market are already in the market. This implies the market is overbought. Conversely, if everyone is bearish, then all of the individuals who could be selling their securities have already done so. That suggests the market is oversold.
The image below is from SentimentTrader and shows how "Smart" money and "Dumb" money views the market. 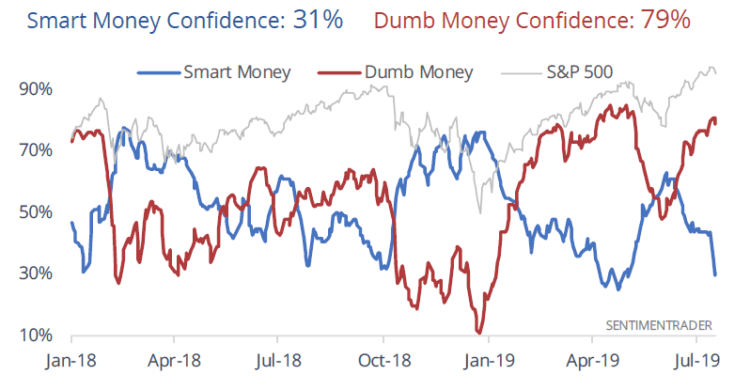
This suggests that retail investors have become overly exuberant and do not realize a market top is at hand. Market breadth is currently weak and the excessive optimism in the market has all the ingredients for a short-term market reversal. With August and September being one of the weaker months for stocks, it will be interesting to see how this plays out.