


With the S&P 500 hitting a new all-time high this Friday, it is hard to find a case where even the staunchest bear participants are not on board this bull train. Since hitting the October 2023 lows, the S&P 500 has surged more than 23%, with weekly positive gains for most of this year. Now, market strategists such as Ed Yardeni are suggesting that the S&P 500 can hit 6000 by 2025.
Inflation is still a major concern for investors, and though current conditions show improvements from 2022, many investors believe this is one key driver for the markets. However, as we discussed in our prior blogs, market sentiment is the primary driver for the financial markets. Right now, everyone is on board the bull train.
Big Picture
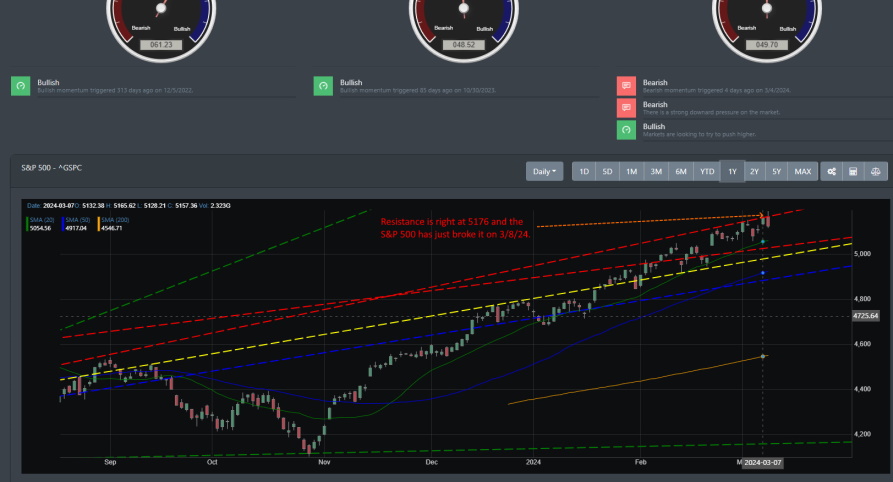
The S&P 500 had an upper resistance region near 5176, and it was able to drive through this to close Friday, 3/8/24, at 5189.26. The S&P 500 has closed firmly weekly for most of this year. However, all was not rosy, as Friday's close saw the index close with a lower close. This is not something to be concerned about initially, but the last time we saw the S&P 500 close out at a lower close was the first week of the year. The S&P 500 has hit the Fibonacci extension from the October 2022 lows, and there is a high potential that markets are set to take a breather in the coming weeks.
Market Breadth
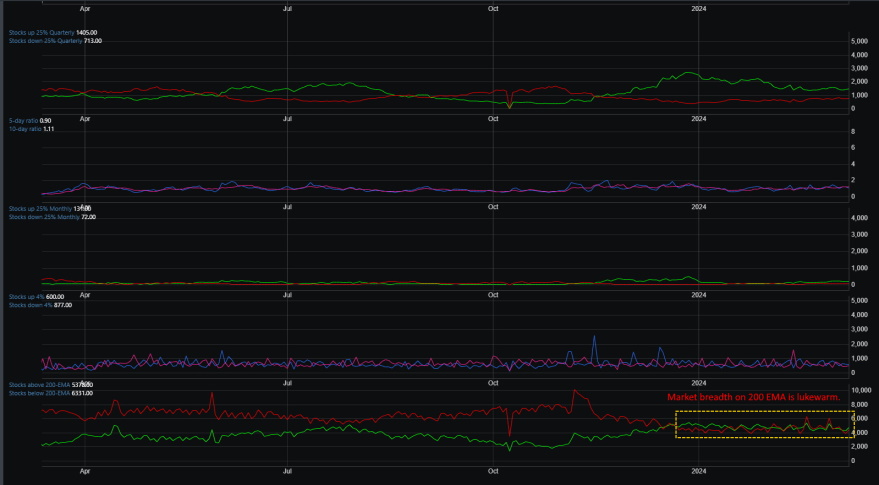
Market breadth is improving across the board. The intermediate market breadth indicator (stocks up or down 25% quarterly) is still positive. The near-term indicator is positive as well. If we are looking at the 50 DMA, more than 60% of large-caps stocks are above their 50 DMA. Many stocks are now recording new highs versus lows. However, not all is quite bullish. We are looking at the chart below, where a red-dashed box shows the universe of stocks that are up or down their 200 EMA. This breadth indicator is still lukewarm at best and has been negative since 2022; we are still not seeing a bullish upward move.
Market Sentiment
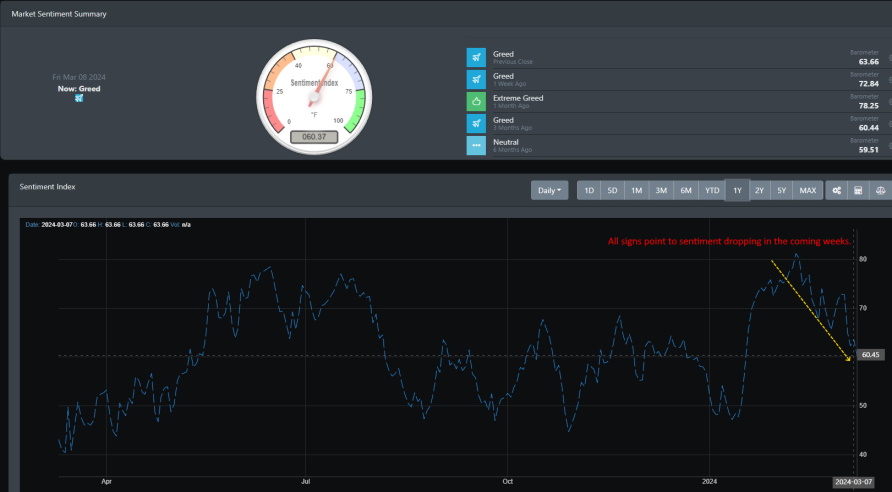
Market sentiment has been bullish for the past few months, and it has been highly bullish for much longer than ever in the last three years. Additionally, it hit an all-time high on February 9, 2024, with a daily reading of 81.14. The previous all-time high was hit on October 25, 2021, with a daily reading of 79.93, after which markets rallied for a month before turning over.
From the chart below, bullish sentiment looks exhausted, and from the weekly sentiment reading, sentiment suggests that it may start moving lower into the neutral category in the coming weeks.
Market Outlook
With growth stocks looking to reach their peak relative to value, trading from technology and semiconductors to value and small caps may be egress. We can see this from last week as the Russell 2000 has broken out from its two-year trading range. The AI boom may be popular but has yet to translate much in providing profits to the earning reports. We may see a shift from investors trading on the Magnificent Seven into small caps shortly.
SPY
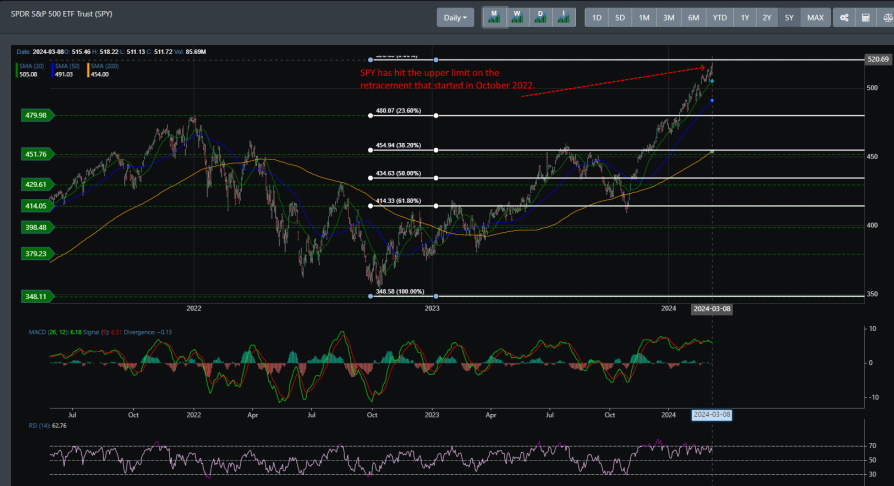
SPY has hit its upper Fibonacci retracement level, and all signs point to a pullback. With some exuberance in the markets, support should hold above the 500 regions, but any breakdown through this support level could see a deeper retracement in the coming weeks.
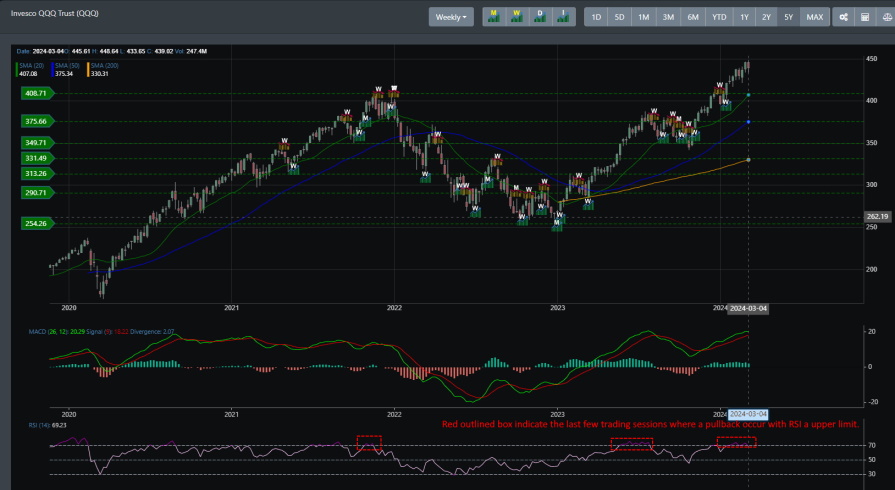
QQQ
Looking at QQQ on the weekly time frame, we can see that the tech index is in the upper bounds of its channel, and the upside is limited without a much-needed pullback. The RSI readings also suggest that QQQ is highly overextended and due for a pullback.
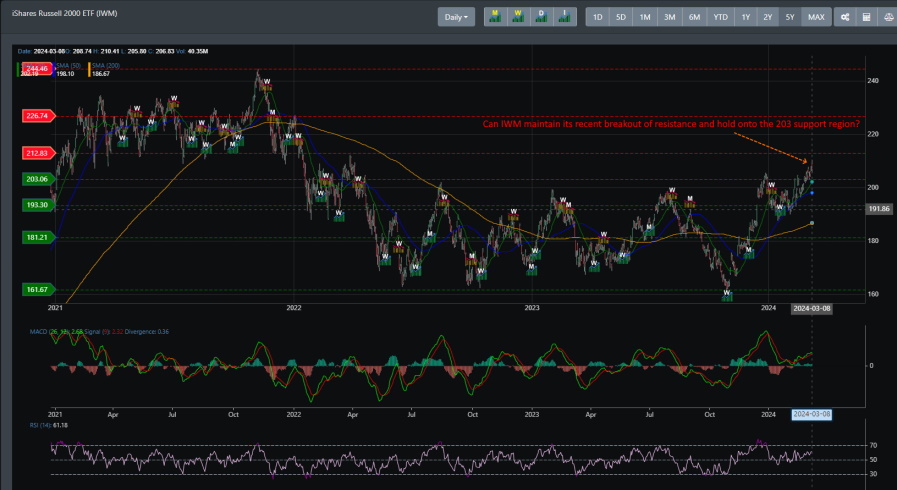
IWM
IWM has been on a strong rally since hitting its weekly bullish signal on 10/30/23. After receiving its monthly buy signal on 12/1/23, it soared higher to where it has now broken through its trading range of 161 to 181. Several market pundits call this a bullish breakout - however, there is strong resistance at this level, and IWM has failed to break through this for the past two years. If it can hold onto support at the 203 region, there is potential for it to move higher. However, any breakdown of this could mean a move back into its two-year-long trading range.
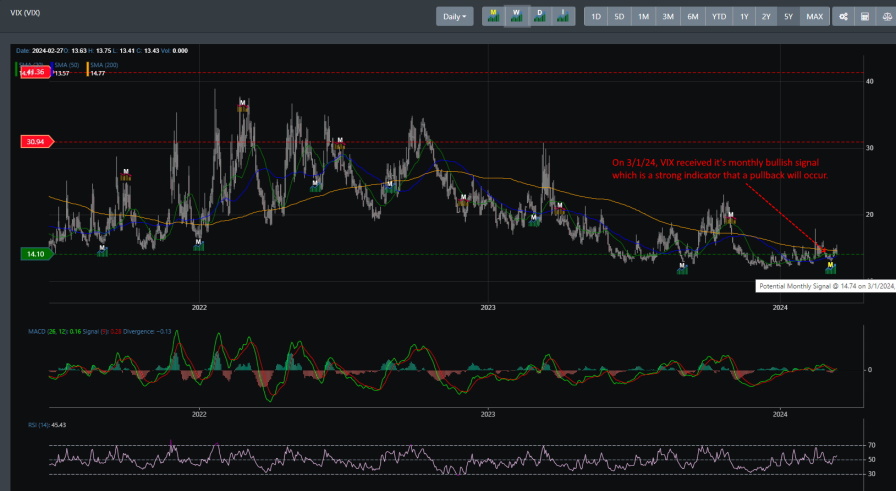
VIX
With all the FOMO that has been present since the start of 2024, we now see a concerning signal for the bulls. On March 1, 2024, the monthly buy signal for VIX was triggered. If you look at all the prior monthly buy signals below in the chart, you can see that markets had pullbacks to follow. Because of this, we expect to see a pullback form, with the potential to start in the coming weeks.
Concluding
The S&P 500 finished this week encroaching on an upper resistance level near 5176. It pushed through this to close Friday's trading session with a new all-time high. However, this may be short-lived in the near term. Market conditions are highly overbought, and the VIX is now firing a monthly buy signal. This signal typically indicates that a pullback is due. Support is currently near the 5040 region, and if markets can hold this region, there is potential for FOMO to push markets higher in the near term (with resistance near the 5300 region). However, there is a strong indication that bullish sentiment is exhausted, and a welcome pullback is forming.