


to all-time highs...
With all the uncertainty with the global pandemic, U.S-China tensions, social unrest, and unemployment benefits expiration, the S&P 500 is already posting positive returns for investors in six of the last seven weeks. Since its low on March 23, 2020, the S&P 500 is now up 50.8%.
If we look at MogulUp's Big Picture analysis, we can see that the S&P 500 Index is approaching its record high of 3,386 set back on February 19, 2020. In fact, for a period of 100-days, this is the largest historical gain ever made by the index. You can see below that the green arrow indicating February's highs are almost within sight. Additionally, you can see the near V-shape recovery posted from the index since falling in March.
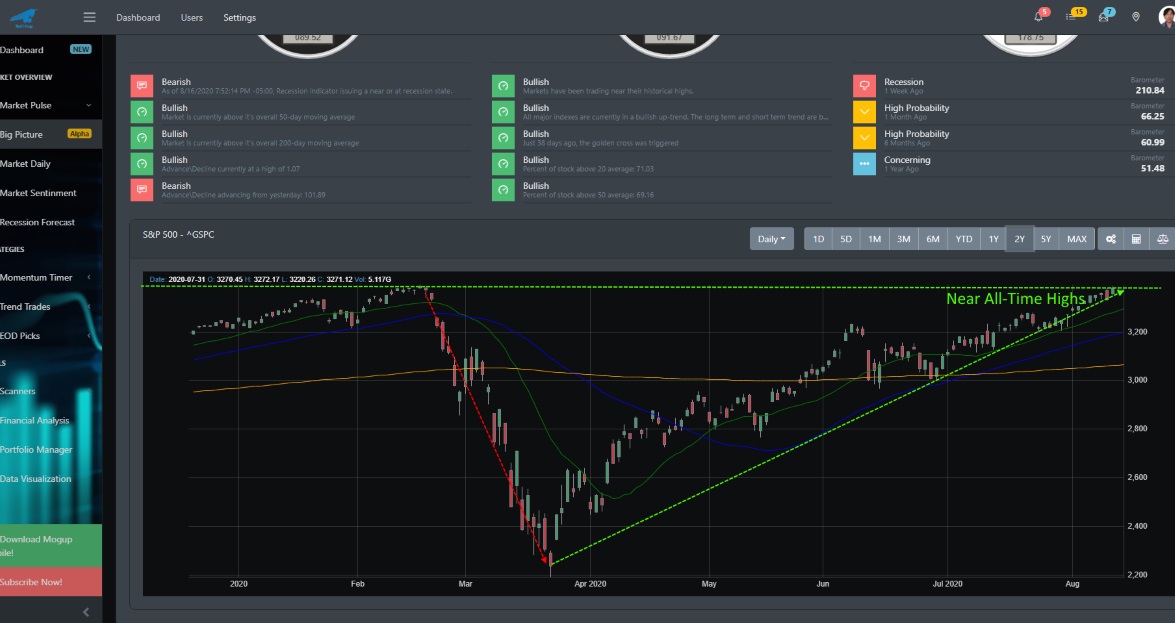
Interesting enough, the last time the S&P 500 made this type of gain was back on July 30, 2009. Right after the financial crisis, the S&P 500 posted a 45.9% gain and the 12-month gain that year for the S&P500 was over 11%.
Market Sentiment
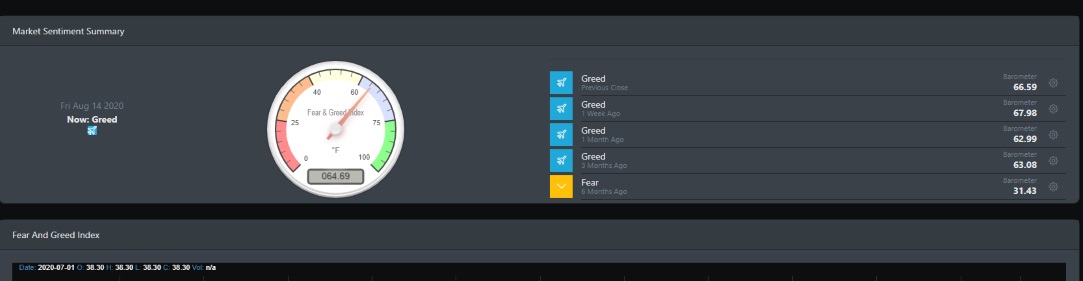
BullGap's market sentiment reading has been reading bullish for the past 3 months. The indicator is currently reading 66.59. The market is currently overly bullish and the fear of missing out (FOMO) has certainly kicked into gear.
Economy Outlook
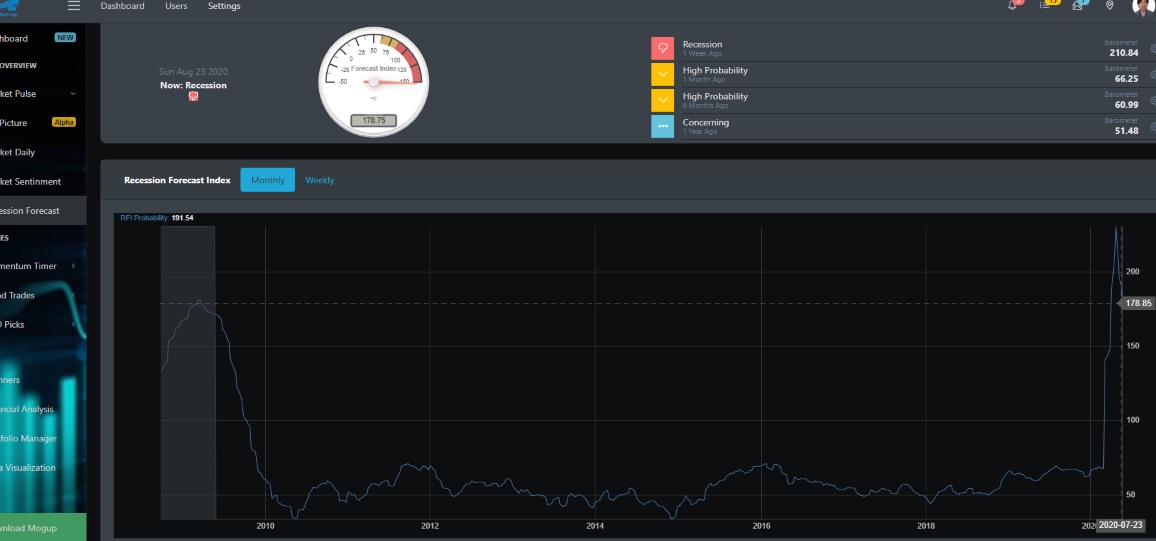
As outlined in our prior post, the U.S. economy is slowing turning the corner and headed up. To sum up, there is ample liquidity in the market (Fed QE policies) and the long leading and leading indicators are slowly moving up. Unsurprisingly, BullGap's recession indicator is still reading a high of 178.75. But clearly, this has dropped off from the highs of 200s set back in April.
Coincidental Indicators
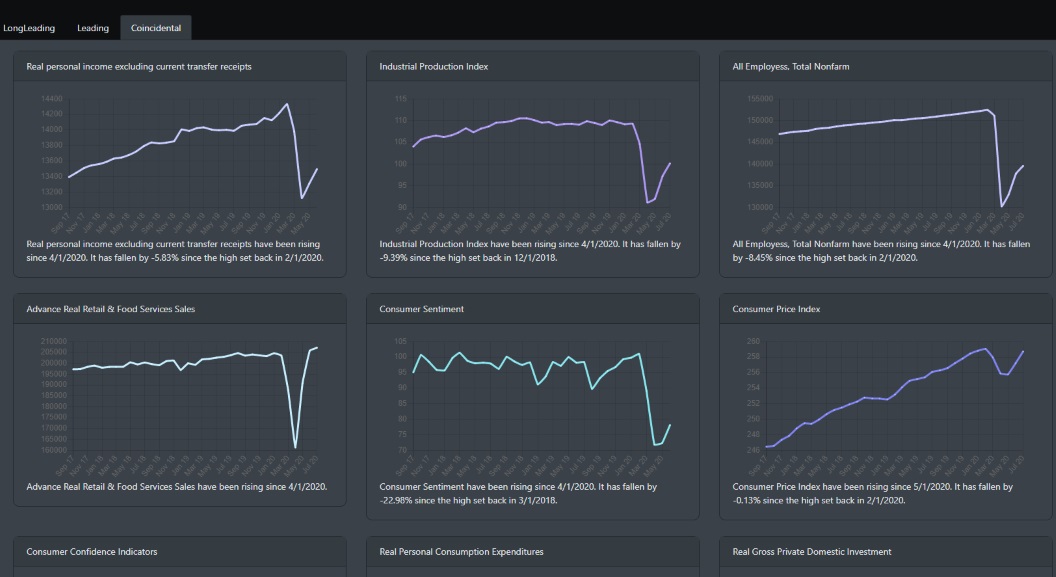
What is most interesting is the coincidental indicators. Looking over at the real personal income data, you can see that starting in May 2020, it rose after a disastrous fall to historical lows. This rise is most likely attributed to the stimulus package and the $600 a week unemployment benefits. What will this reading look like in the next month or two as Congress works out what the next stimulus package will cover? While both Republicans and Democrats try to agree on what the next additional relief for business and consumers, the retail space, industrial production, and consumer sentiment are moving in an up-trend. Advance Retail and Food services are back at pre-pandemic levels. Take a look at 2 consumer ETFs and you will see that a V-shape recovery is currently underway. XLP and XLY.
Market Readings
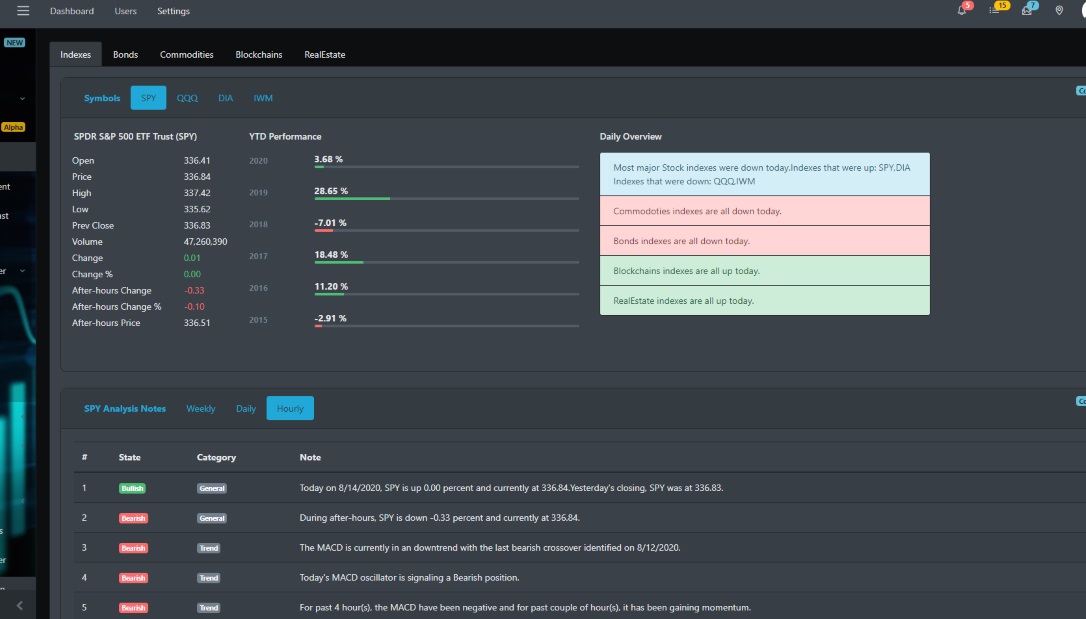
For the most part, the market this week moved in the bulls favor. The S&P 500 is inching closer to February's highs. Overall, most indexes for the week have been up by more than 2 percent. SPY is testing technical resistance and IWM broke out of resistance and is currently forming a pennant pattern.
Treasury Market
The biggest headliner for the week has been the sell-off in the treasury market. Looking at the image below, you can see that TLT has broken trend and is now trading below its 50-day DMA.
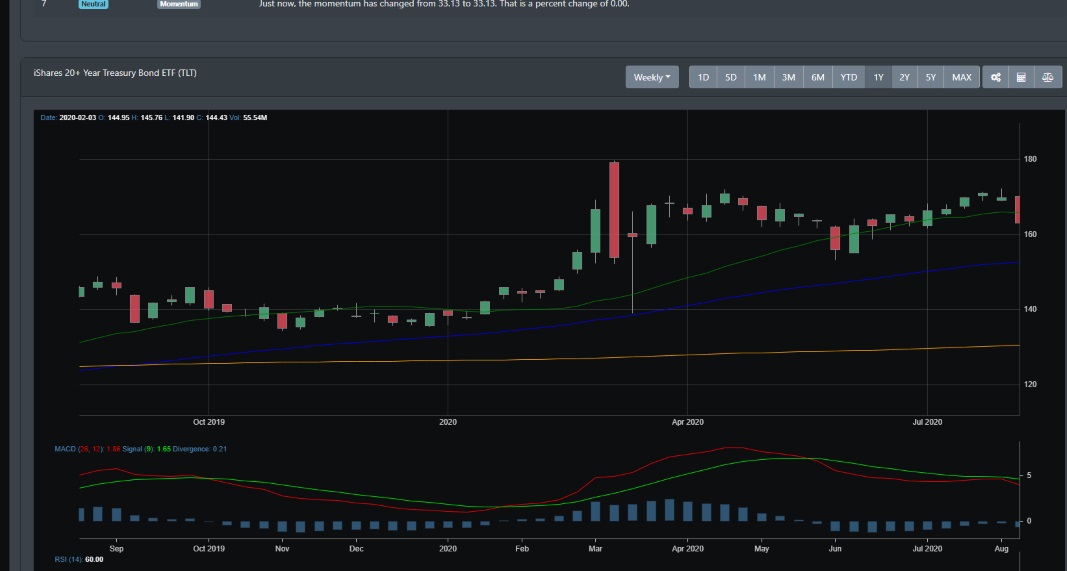
Momentum dropped and volume was higher on the sell-off. BullGap's readings of the treasury showed the downtrend begun in June and has now moved where the daily and hourly charts are reading bearish. The 10-year Treasury is currently at 0.7% from its low of 0.55% (August 4, 2020). This is certainly bolds well for the bulls and the equity markets. Investors are going to realize that higher returns are more likely inequities. Money may move from the treasury market and help fuel the current market rally.