


Markets roared out of the gates last Monday but were cut short on news of Trump shutting down stimulus talks. Shortly later, Trump retracted his comments and the market took this as a cue to kick start into high gear. Imagine, the Russell 2000 is now at its highest levels not seen since pre-COVID 19. SPY broke to the upside and is now running to test old highs. Why SPY was falling in September, it is now firmly in the bullish territory.
Big Picture
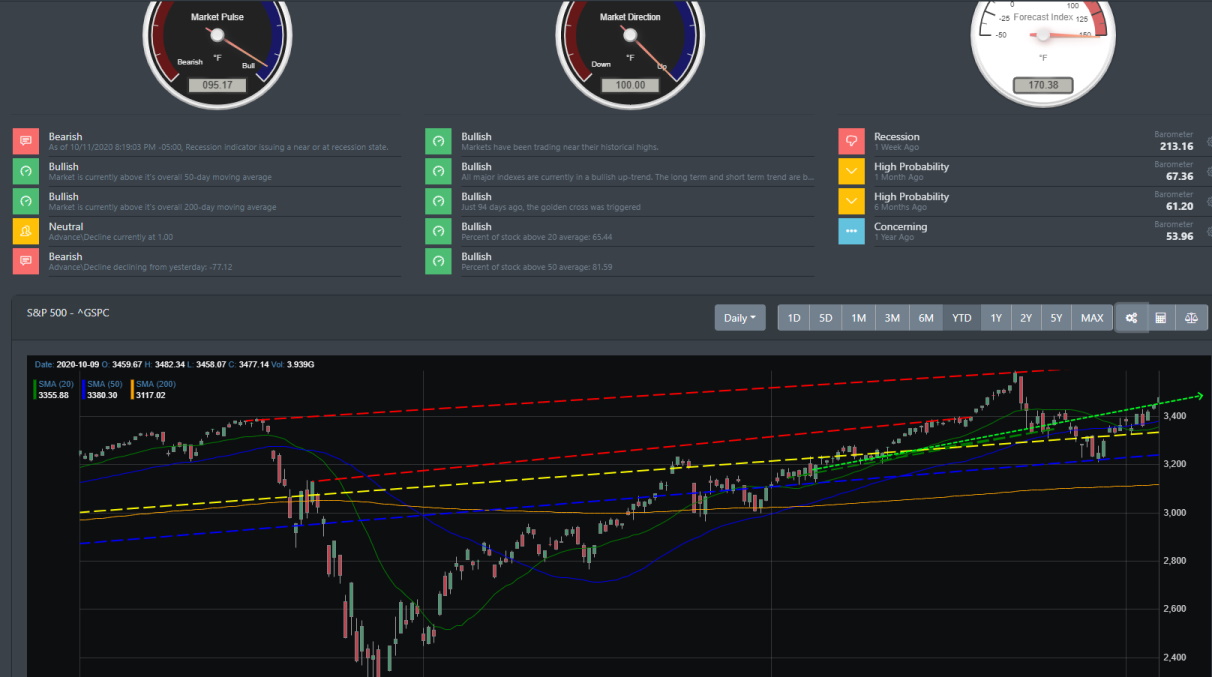
Starting off with our Big Picture analysis, we can see that the S&P 500 has broken to the upside (highlighted in the green arrow). Market breadth is moving in high gear as over 65% of stocks are above their 20 days moving average (DMA). Additionally, there is over 80% of stocks that are currently above their 50 DMA. All major U.S. indexes are in a bullish up-trend.
Market Sentiment
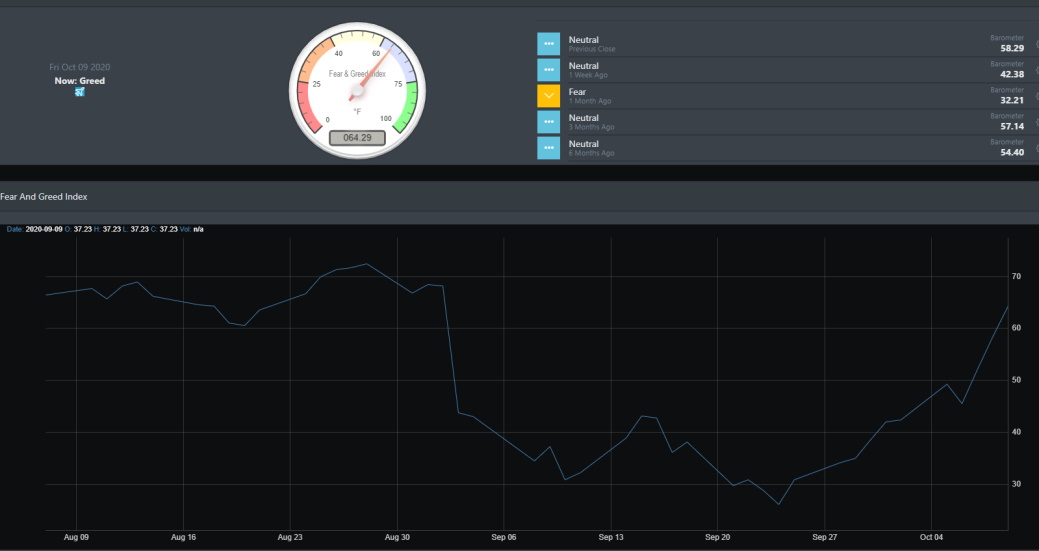
Not surprising, last month BullGap's market sentiment was reading a low of 32.21 (Fear). With the first week of October completed, it has just 30+ points and is reading a Greed reading of 64.29. There was a dip on Tuesday when Trump was diagnosis with COVID but has since moved in a clear uptrend. The last time this occurred was back in late Jun to early July. Right around the time, the golden crossed occurred (50 DMA crosses above the 200 DMA). The market seems to be setting up for a rally to 4000-4250 SPX.
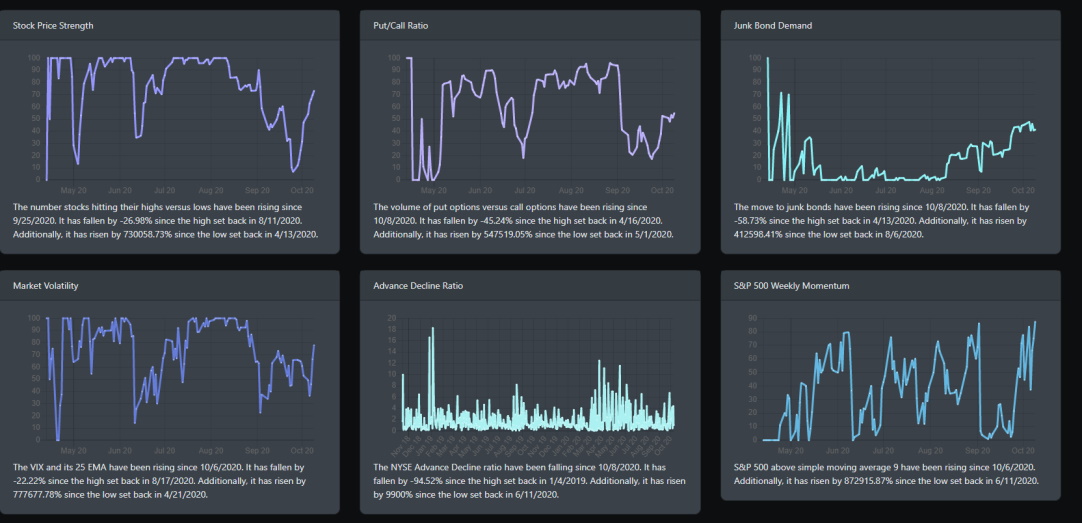
The weekly momentum has risen sharply this week. The number of stocks hitting their highs are on the rise and has begun this ascension since late last September.
Economic Readings
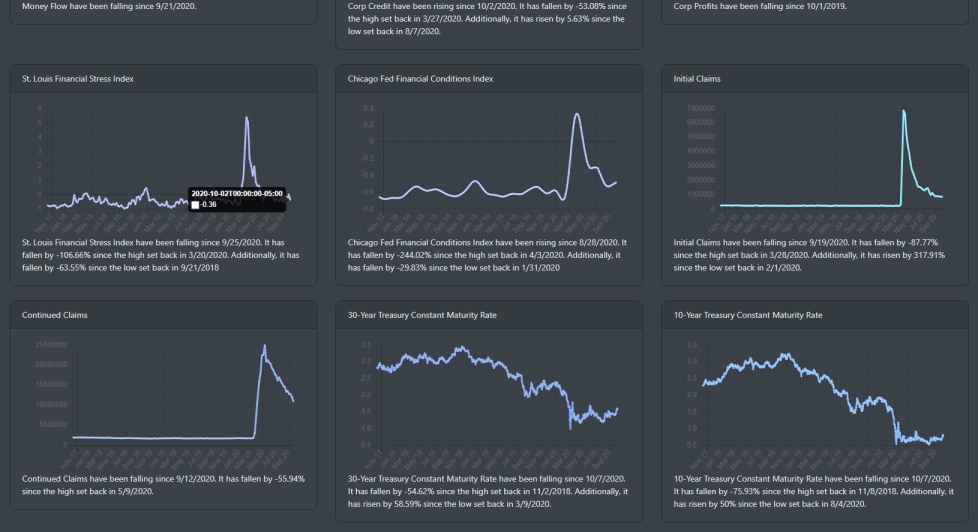
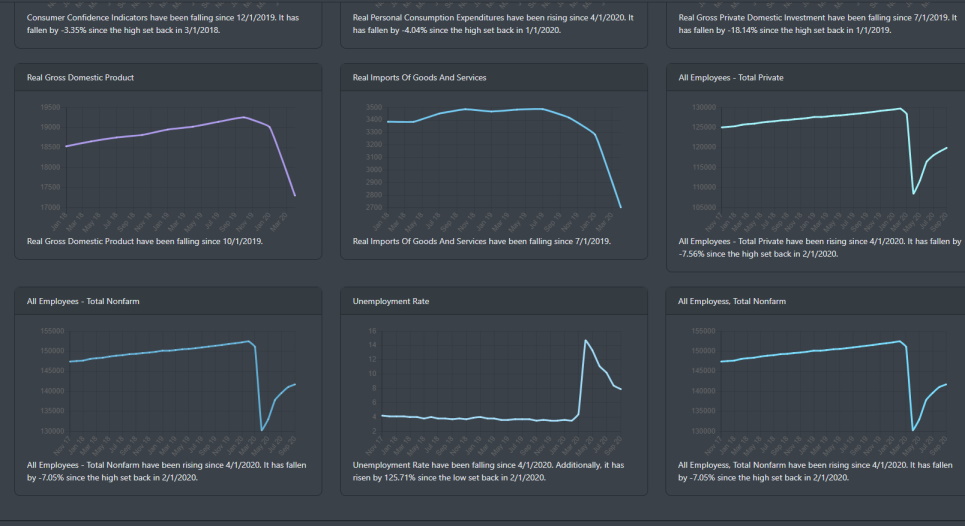
Financially, the economy is in a much better place then it was during the start of the pandemic outbreak. Liquidity is the name of the game as the Fed has been pumping cash into the economy. The Fed's credit market has helped to lower the financial stress on the market. Both the St. Louis Financial Stress Index and the Chicago Fed Conditions Index are showing improvements. Continued Claims declined this week but are still very high by any measure. As discussed last week in our blog, most of our leading indicators are making a V-shape recovery. 1-unit building permits are at their highest levels in five years. New orders for consumer durable goods and non-defense capital goods have all rebounded to pre-COVID levels.
Concidental Indicator
There is one sticking point to all this good feeling from the economy. The labor market is still showing that the labor force participation rate and employment\population ratio is about half their respective pre-COVID levels. In essence, job growth seems to be slowing down.
Market Readings
Not only did SPY break to the up-side but micro and small-caps (IWM) led the market higher. For last week alone, this would go down as one of the better weeks since coming out of September. Additionally, the long end of the treasury market started to sell-off. QQQ also bounced off 20 DMA and is now trending higher.
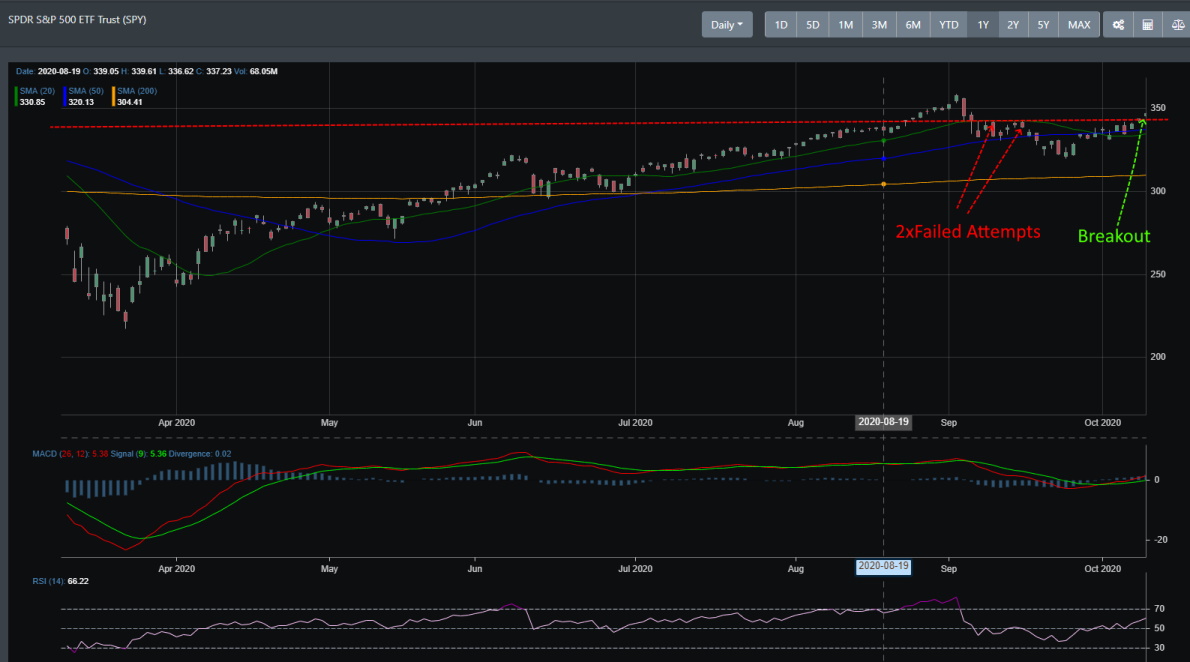
For SPY, if we look at the weekly timeframe, it was near a selling point with the MACD clearly about to cross over. Looking at the daily chart below, you can see that the last 2 attempts failed as indicated by the red arrows. Last week, it has broken out of that resistance line. It is now targeting a test of the old high at around $357. Both the daily and weekly readings on BullGap's daily market is reading bullish.
Conclusion
The market has clearly regained its footing and is looking to test the old highs. With small caps leading last week's market, it is clear that investors are feeling more risk-adverse. With Trump signaling that he wants a stimulus package, it seems that the market is on high hopes that one will get done (although there is still no deal on Capitol Hill). Any bad news like last Tuesday though could send SPY back down to retest the $341 line. One interesting statistical note. Markets surging into a U.S election typical has a good performance of picking the next President. Three months before an election, the performance of the S&P 500 has predicted 87% of selections since 1928. If the S&P 500 is in the positive, the incumbent party wins. If the index suffers a loss in this time window, the incumbent loses.