


The most volatile month of the year for U.S stock and the write up for October 2020 was a brutal and volatile one. U.S stock struggle this week and it coincided with one of the worst weeks in the S&P 500 since March 2020. As mentioned in our prior blogs, VIX for this month on average has been one of the highest since its inception back in 1990. At the closing of October, it was around 38. Earnings are still moving forward this week with Roku, Paypal, and Alibaba next. With the election on Tuesday, there is much to be seen as to where the market will end up in November and the end of 2020.
The S&P 500 had a decline of 6.9%for October but is still positive year-to-date at 1.21%. As mentioned in earlier blogs, this historically bolds well for a re-election of the incumbent President.
As for the earnings, the picture is thus far positive. The third-quarter results are in for over 200 of the S&P members and more than 83% have beaten EPS estimates and over 78% have beaten revenue estimates. However, the big picture is that total earnings are down -11% from the same period last year on -3.% lower revenues.
Big Picture
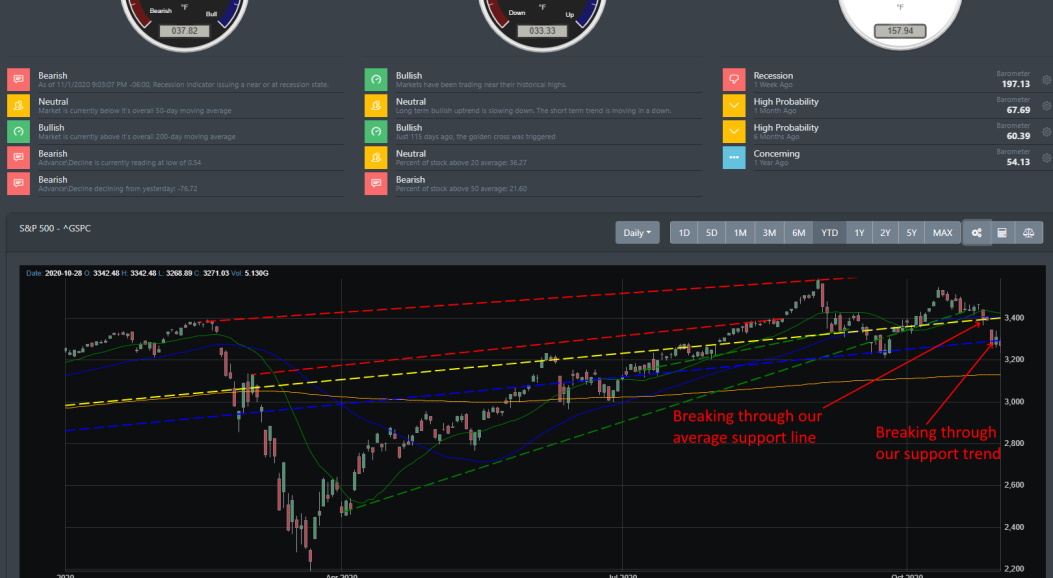
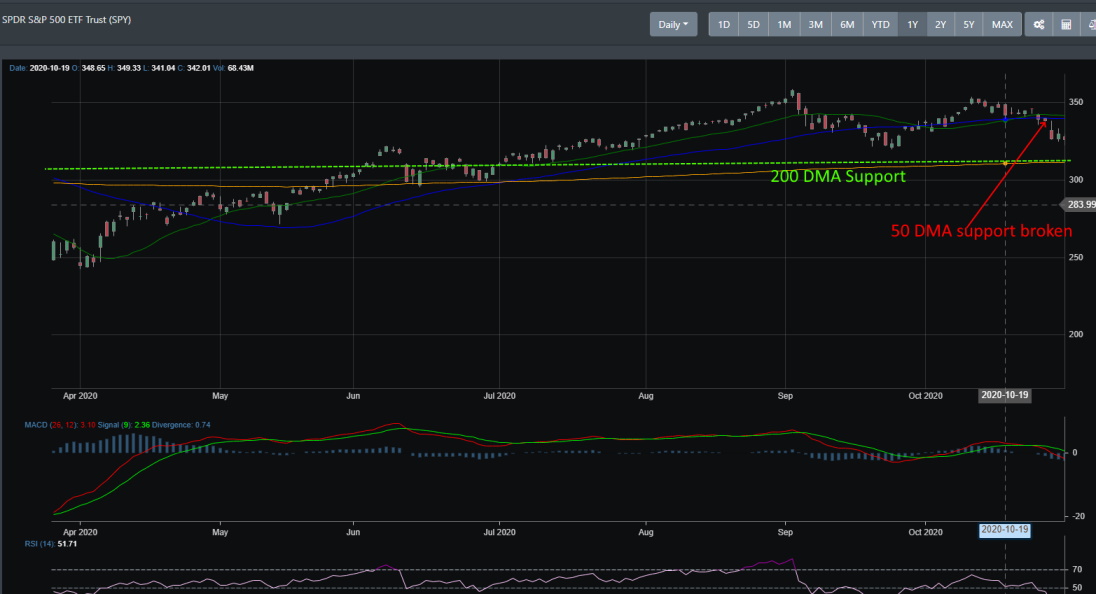
Looking at our big picture analysis, last week saw some bearish tones in the market. With the market pulse indicators moving into the bearish signal and reading mid 30 ranges. Stock breadth is declining and we can see that the S&P 500 broke 2 major trends identified by our deep learning trend line identifiers. Looking at the image below, you can see where we marked 2 support lines that were broken recently. The average support line and the current support line. The S&P 500 is sitting at 3,269 with a -5.64 drop for this week. Where do we go from here? More of that is discussed below.
Economic Outlook
It is clear from our last several blogs, that the liquidity level in the market is on steroids. The long leading indicators are mostly making a V-shape recovery.
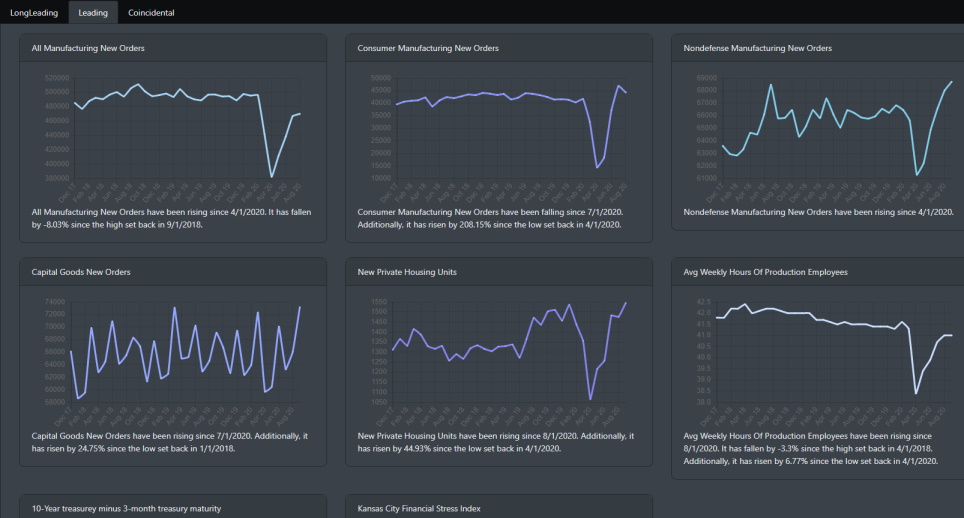
Leading Indicators
New orders of consumer durable goods have dropped off modestly. However, both consumer and nondefense new orders are well above pre-pandemic levels indicating sign that the economic recovery is underway. New orders for non-defense capital goods is at a 5-year high. Likewise, building permits for 1-unit homes is also at a 5-year high.
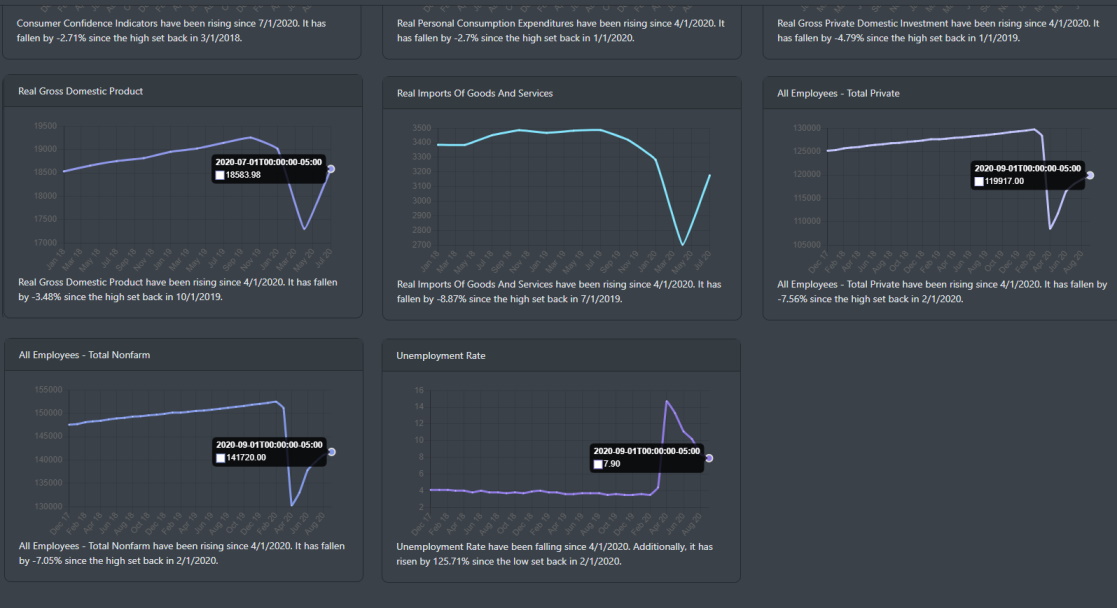
Coincidental Indicators
This week, the BEA released the GDP which shows a strong upward trend. Two key sectors in the GDP report showed a strong rebound. Reqla Imports of goods and services are in a strong rebound. The outlier here is the labor market which will hold back any true recovery. The unemployment rate is sitting at high at 7.9% and all private employee readings are showing stagnation for the last couple of months.
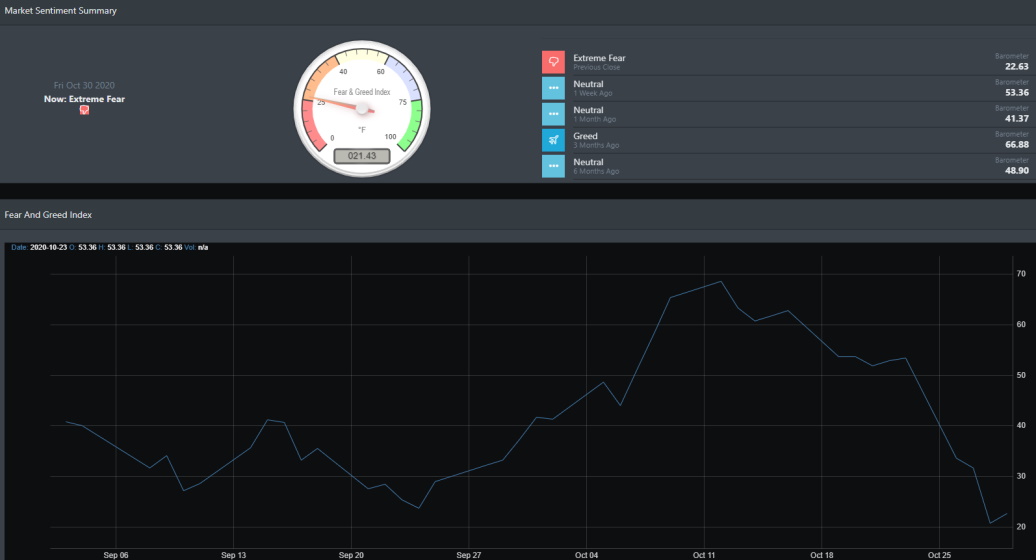
Market Sentiment
The market have been moving from a neutral wait and see since September. Now with October in the books, we can see that the market has switched to fear. The Bullgap market sentiment gauge is reading a very low level of 21.43. It has only been in the low 10 to 20s twice this year. During the initial economic shutdown back in March and in late June when markets corrected.
Market Outlook
The market broke support this week. For October, SPY has is down 3% and has broken through 2 key support levels. The 50 DMA and the 100 DMA broke through the last two trading sessions. The next step below is the 200 DMA outline in the green dash below. SPY has successfully bounced off its 200MA back in June and its 100MA back in September. Will it do the same when the market drops near its 200 DMA?
For now, the technical signals have been indicating a sell signal for the past couple of weeks.
Concluding
The market did have an ugly week. However, the sell signals that have been present for the past couple of weeks are reverting to a point where there could be a high probability for a short-term rally starting this coming week. Our Momentum Market timer with our Deep learning system has systematically identified sell-offs like last week to historically rally the following week. There is a strong likelihood that an upward retracement is highly likely for this coming week. For the past month, we have seen selling pressure during the day and buying pressure during overnight trading. And again, given the selling pressure for the past couple of weeks, most of the short-term technical indicators are near lows.