


All major indices dropped last month. Prior to that, we saw a risk-off trading environment that allowed mega-cap tech stocks to soar to all-time highs. Then September came along and all major indices fell sharply over the following consecutive weeks. The S&P 500 was at one point trading below 10%. A new month and the dip buyer came back in last week. Last week, the market pushed higher and had a breakout. After 4 consecutive down weeks, the S&P 500 is up 3% year-to-date. In fact, all major indexes were in the positive last week. Nasdaq was up +1.48 percent while the Russel 2000 made a positive weekly of +4.37%.
Big Picture
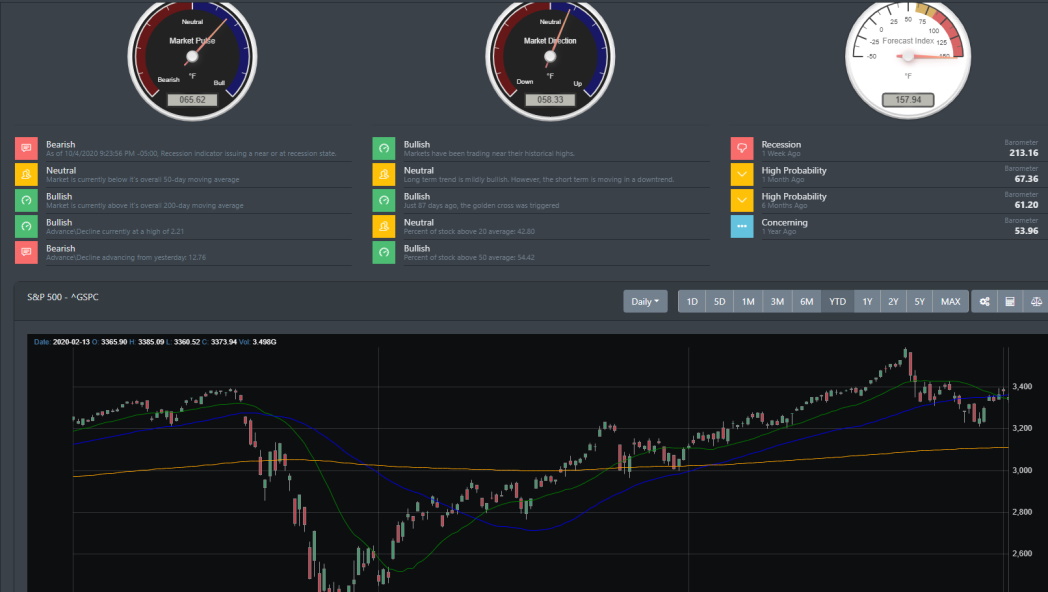
Let's start by taking a look at the big picture analysis for last week. What wonders a week will do for the market. The market gained 1.5% on the week and the trading range has been much higher than in recent weeks. The image below captures where the S&P 500 has broken through its 50-day moving average (DMA). However, at the tail end of the week, we did see the 20 DMA cross over suggesting some downward pressure may still be present. More than 54% of the market participants are now above their 50 DMA.
U.S Employment Sector
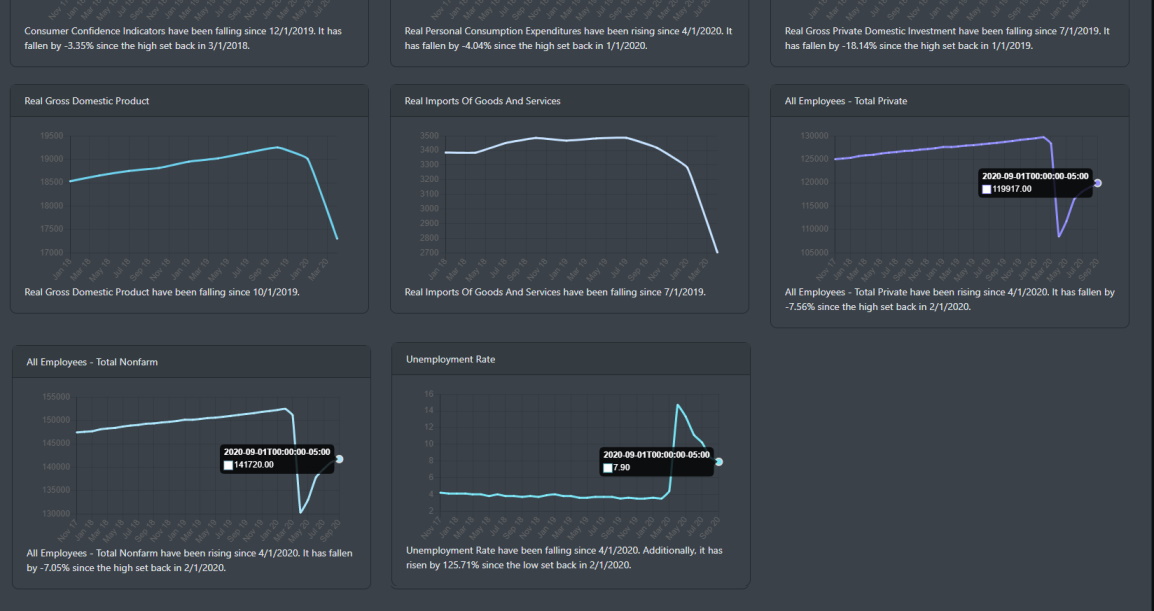
September's unemployment numbers declined to 7.9% which beat the expectations of 8.2%. However, Non-farm payrolls did miss expectations and increased by around 661K in the month of September. One positive item that stands out is the private job sector which has recovered more than 50% of the jobs since the pre-pandemic levels. The unemployment rate has been declining but still considered high.
Market Readings
It has been a positive week for the bulls. 10 out of the 11 sectors were pushed higher last week. Interesting enough, real-estate was the top gainer followed by financials.
SPY
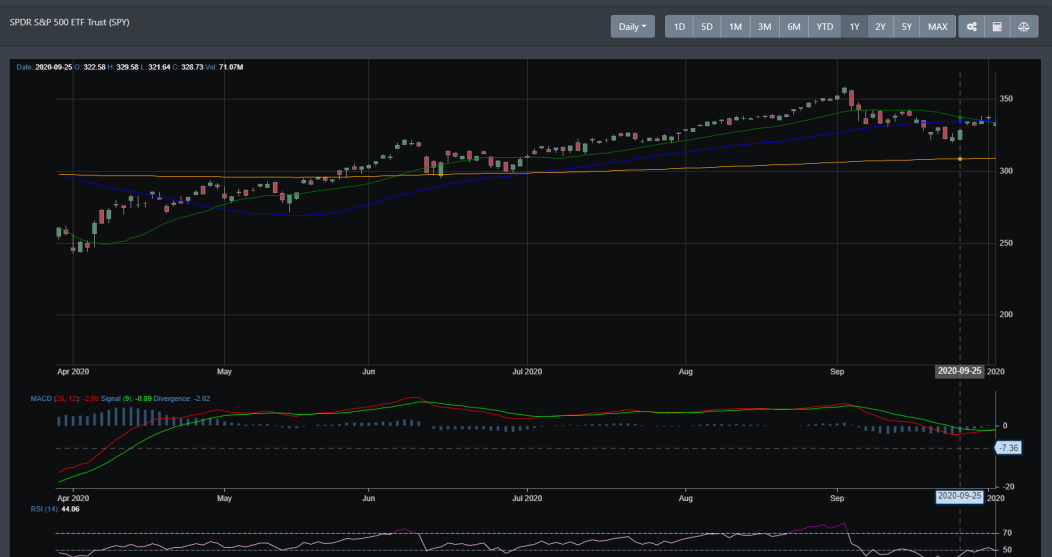
For SPY, it broke out of resistance but has since late last week traded mostly sideways. This could have been because of the recent political unrest late last Friday. SPY is currently sitting at a 331 support level. The MACD also has triggered a daily buy signal.
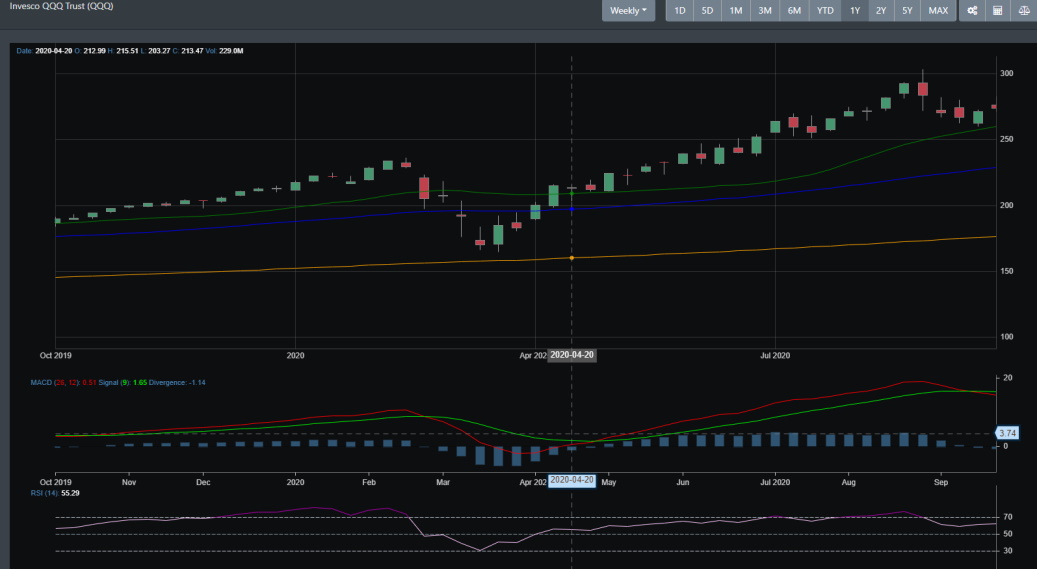
QQQ
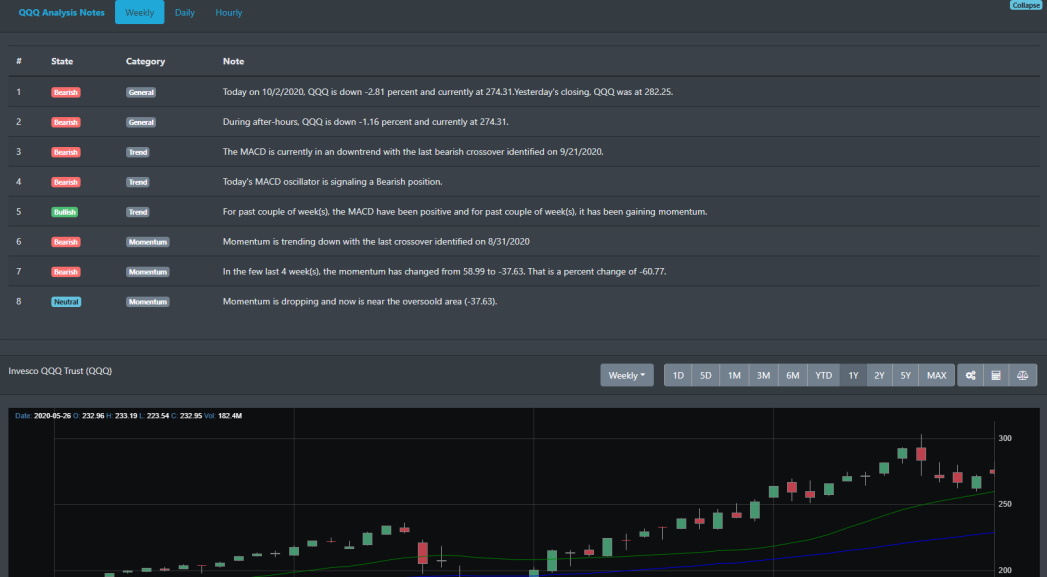
Like SPY, QQQ also had a breakout but if we look at the weekly analysis, QQQ is posting quite a few bearish signals. The weekly cross-over of the MACD occurred last week. QQQ had fewer drops on the daily reading but had its biggest drop on Friday. This was most likely due to the heightened political risk that occurred.
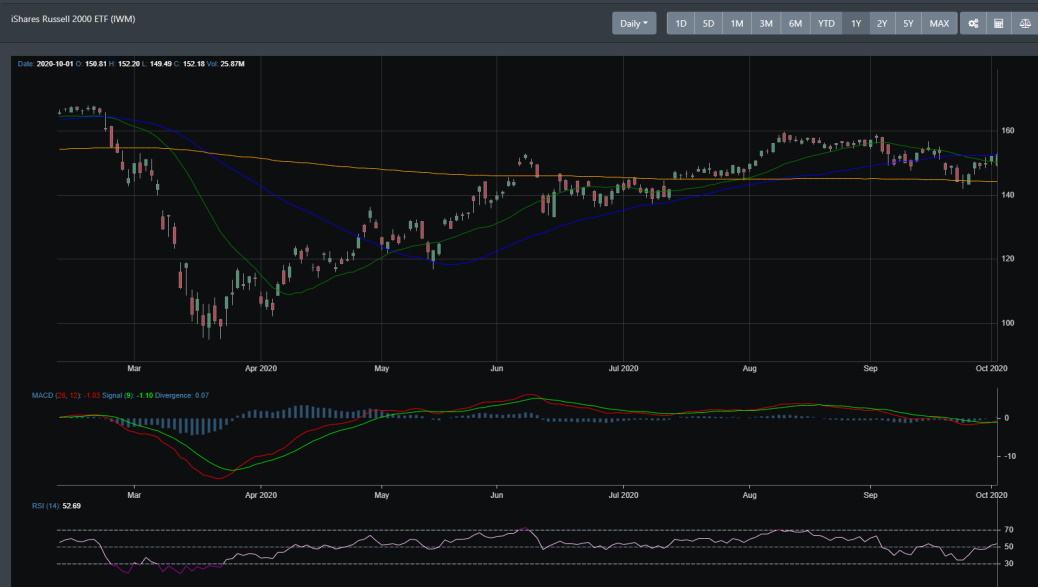
IWM
On Friday, small-caps printed a solid bar. IWM rose to 4.4 compared to SPY's 1.6% gain. On a tumultuous Friday, IWM managed to gain more than 0.4%. This could indicate a stronger risk appetite in the market. Though IWM was down 3.5% for September, it has posted 42+ percent in the last 6 months.
Conclusion
Well, we finally made it to the final quarter of 2020. Elections are around the corner and we should hear plenty of updates on President Trump and his condition with COVID-19. The markets overall had a good start for the month of October. That said, SPY, QQQ, and IWM are battling their 50-day moving averages. SPY was looking to hold above it's 50 DMA on Friday but feel too late selling on the news of Trump catching COVID-19. After the golden cross in July, Us. markets have been surging to all-time highs. And right on cue, it hit up against the notorious September month (the most volatile and difficult period for the bulls). With the fourth quarter being historically friendly to the bulls, FOMO may just kick in again. However, with US elections only four weeks away and fears of a second wave of COVID-19 stalling economic growth, only time will tell how this market ends for October.