


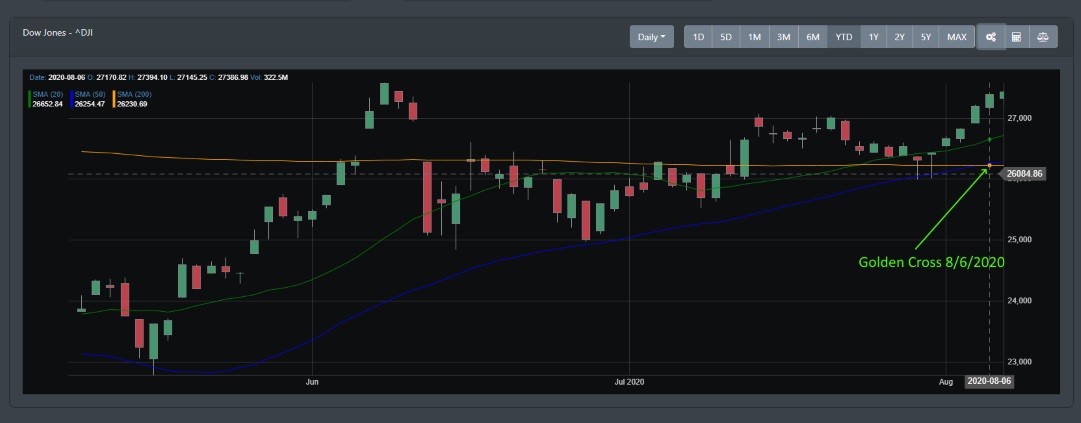
Look who just joined the party!
On August 6, 2020, the Dow Jones formed the "Golden Cross" when it's 50-day moving average (DMA) broke above its 200 DMA. It now joins the S&P 500 and NASDAQ. As most investors are keen to believe, this traditionally signals a bullish trend. The DOW has not posted this signal since way back on March 19, 2019.
Current Economic Readings
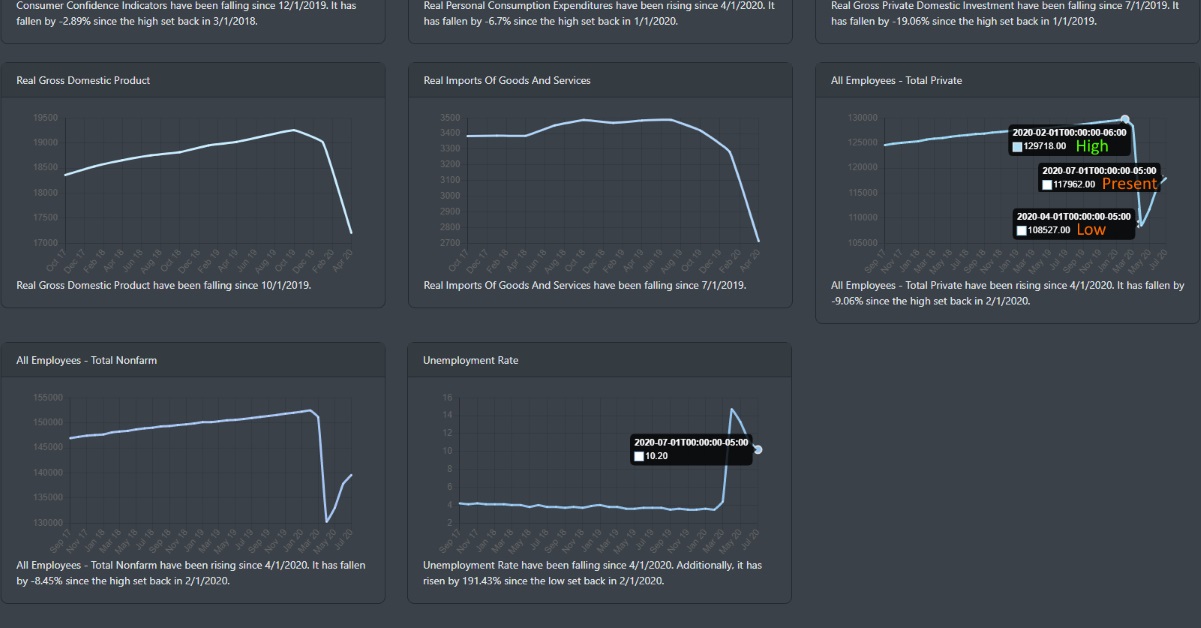
As stated in our last week's blog, our long-leading, leading, and coincidental economic indicators remain pretty much the same. To summarize, there is ample liquidity in the market and the economic readings are showing improvements. Though they are still not near the pre-pandemic levels, there is an uptick in major areas of the economy. For our subscribers, you have daily access to all economic data in MoglUp. Let's take a look at the job numbers since the latest came out on Friday 8/7/2020.
If we take a look at the private employment data below, we see the green high represented by 129,718,000 jobs. That employment number was recorded on February 1, 2020. When COVID-19 hit, that data point dropped down to 108,527,000 (April 1, 2020). That was a 16% drop in a matter of a few months. Now, if we look at the most recent employment numbers, it reads 117,962,000. That is an increase of over 8% since April's low. Still low as compared to February's high but the point is certain - Recovery is on the uptrend.
Additionally, if we look at the unemployment rate. It too has been falling since April 2020.
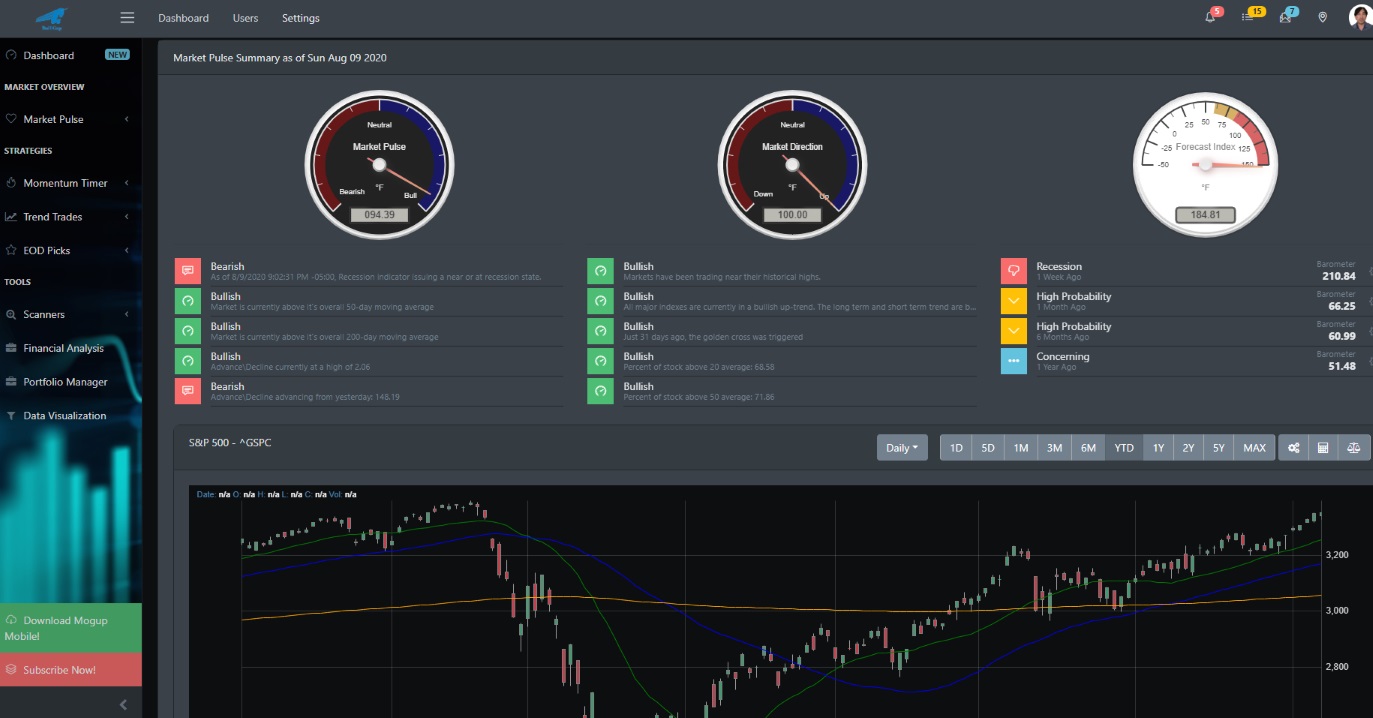
Big Picture Reading
It looks like the bulls have pretty much beaten the bears in July and are now moving firmly into early August. The Big Picture readings show more than 70% of stocks above their 50 DMA. More than 65% are above there 20 DMA. Market Direction, Market breadth, and Market pulse readings are bullish. From our last blog, Market breadth was a concern as a majority of stocks were not participating in the rally. Market breadth has increased since our last discussion in July.
Daily Market Reading
All sectors were higher this week. Small-caps had a breakout (6% gain) on Friday 8/7/2020. QQQ edged higher but struggle for some parts of the afternoon. As expected, the Treasury\Bonds market dropped.
Though Gold is up +1.8 for the week, it ended Friday selling off a bit as well. Speaking of precious metals, Silver has more than doubled since its severe crash in March. COVID-19 and a possible trade war with China and the US and social unrest, has sent investors to the safe-haven metals. With the US dollar index has sold off and hitting 93 lows, it could leave more room for the Gold and Silver to climb higher.
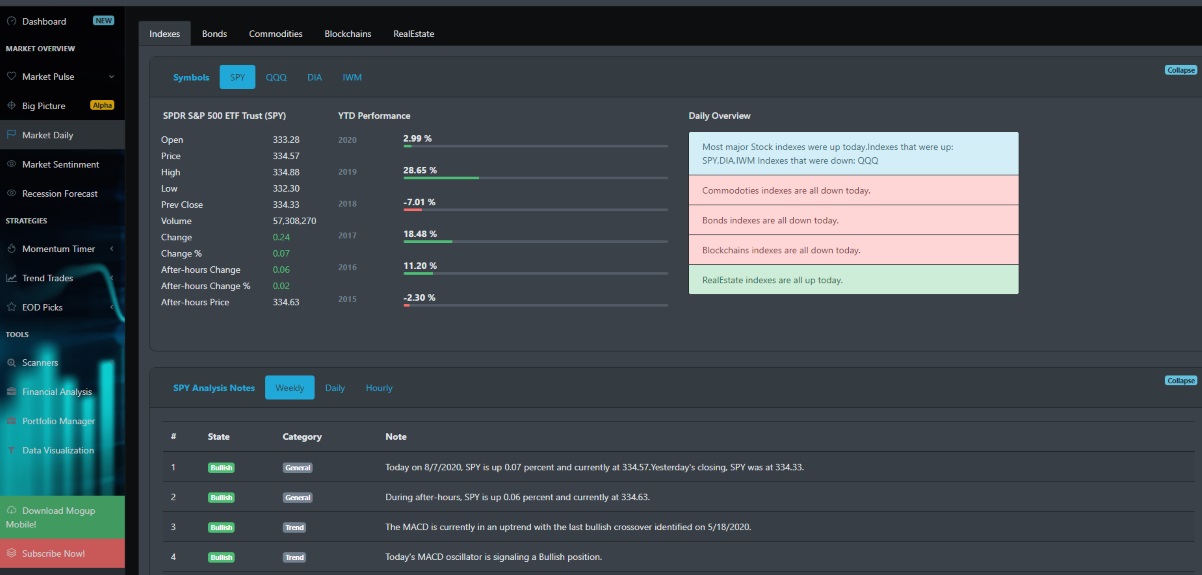
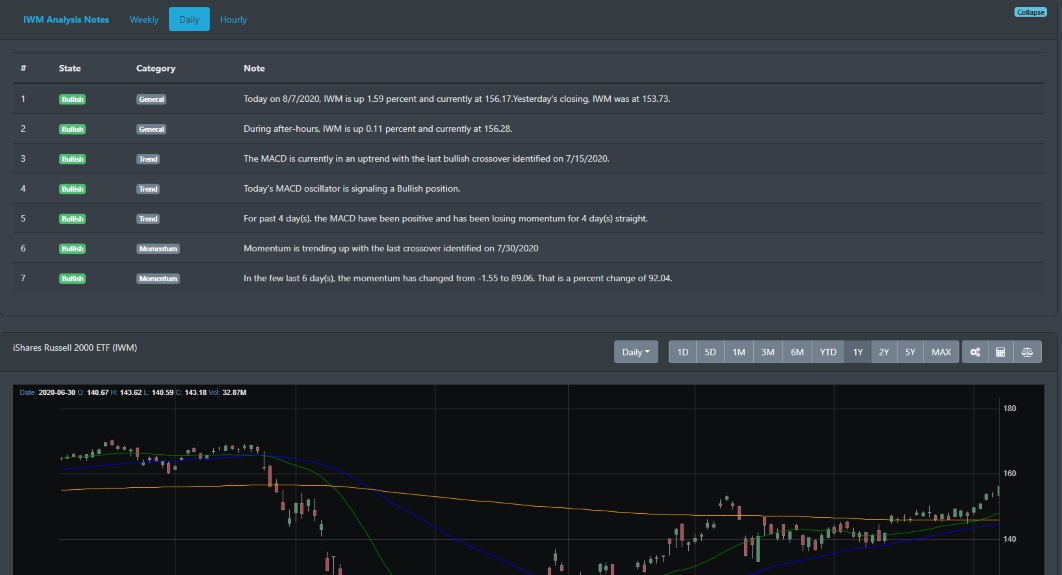
IWM breakout
IWM is having a breakout as shown in the image below. The weekly, daily, and hourly trend is bullish.
Final words
It's a safe bet that the market has outrun the expected. With small-caps and micro-caps moving higher, it would be interesting to see other sectors affected by COVID-19 join in. Airlines and Energy. The irony of what COVID has created is all these other mini bubbles - Gold and Silver.