


For the past few blogs, we discussed how there is an exorbitant amount of euphoria in the market. We also discussed heading into December that there would be likely some selling from fund managers that would draw the market down. This played out last week as we saw the market struggle to maintain its breakout levels. However, this current rally is being driven on pure momentum and FOMO has helped hold the market at key levels. All major indices are setting records and there plenty of fuel to this rally. As discussed in our prior blogs, the U.S and the global economy are making a rebound.
Big Picture
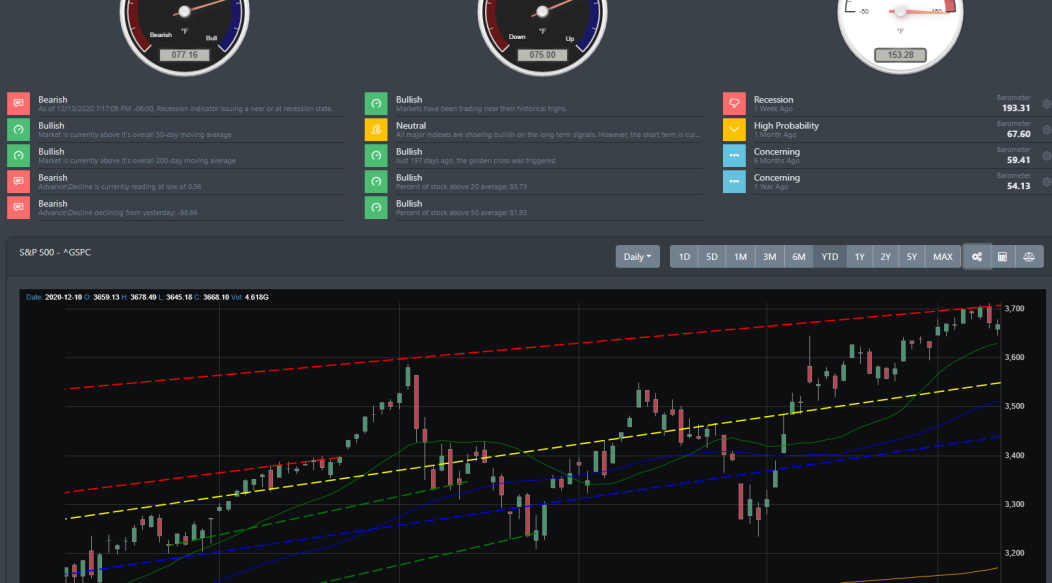
Momentum dropped more than 20% last week but as noted above we expected a short-term correction was coming at the beginning of December. That said, all major U.S indices closed at record highs last Friday. The Nasdaq shrugged off last Monday's sell off and pushed later into the week to posts its 48th new high. Despite news that Congress is now stalling on the stimulus talk, the equity market still is heading in an uptrend. The chart below shows where the S&P 500 is just right above its 50 DMA and the current trend is still very bullish. Though conditions are still overbought and overextended since the first week of November, the markets are currently taking a breather. The Russell 2000 has leed the charge and was up more than 5.3% in the first 6 trading days of this December.
Market Breadth Primary Indicators
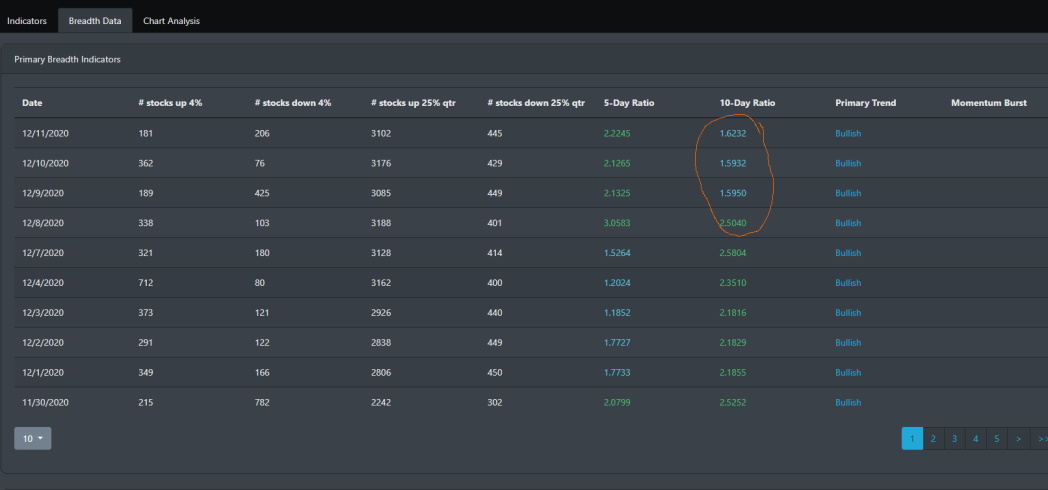
Below are the readings for our Market breadth analysis and we can see where on Wednesday the market reversed sharply. The 10-day ratio provides a key reading as to where the market is currently being played out. The readings are still bullish and the selling in the latter part of last week never gained much traction.
Market Breadth Auxilary Indicators
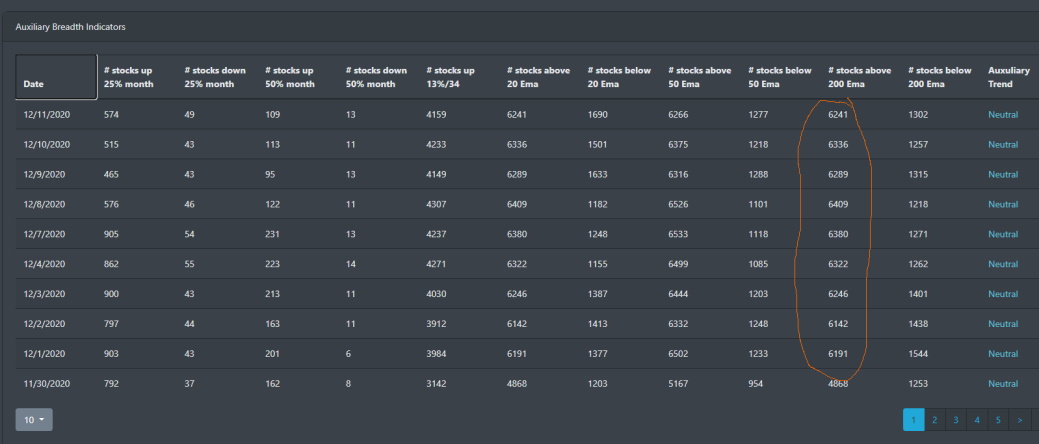
We are still seeing a large percentage of stocks trading above their 200 EMA. In fact, IWM is now trading 3 standard deviations above its 200-week moving average. The S&P 500 also is also pushing back up into 3-standard deviations. Overall, Bullgap's market breadth reading is reflecting the sheer bullish attitude in market participants.
Market Reading
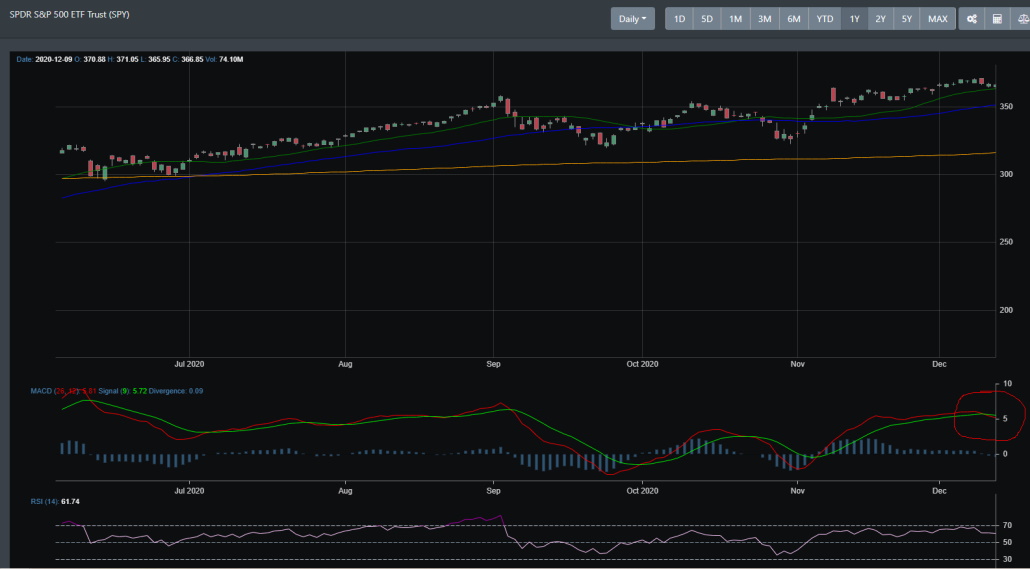
Looking at this week with the daily chart reading for all major indices show a short-term top occurring. Below are charts from SPY, QQQ, and DIA. The MACD is triggering a sell signal for each major ETF. The market daily readings closed on Friday with most indices lower. Bonds were marginally up for that day.
SPY
The below circle in red shows the MACD cross-over occurred a few days ago.
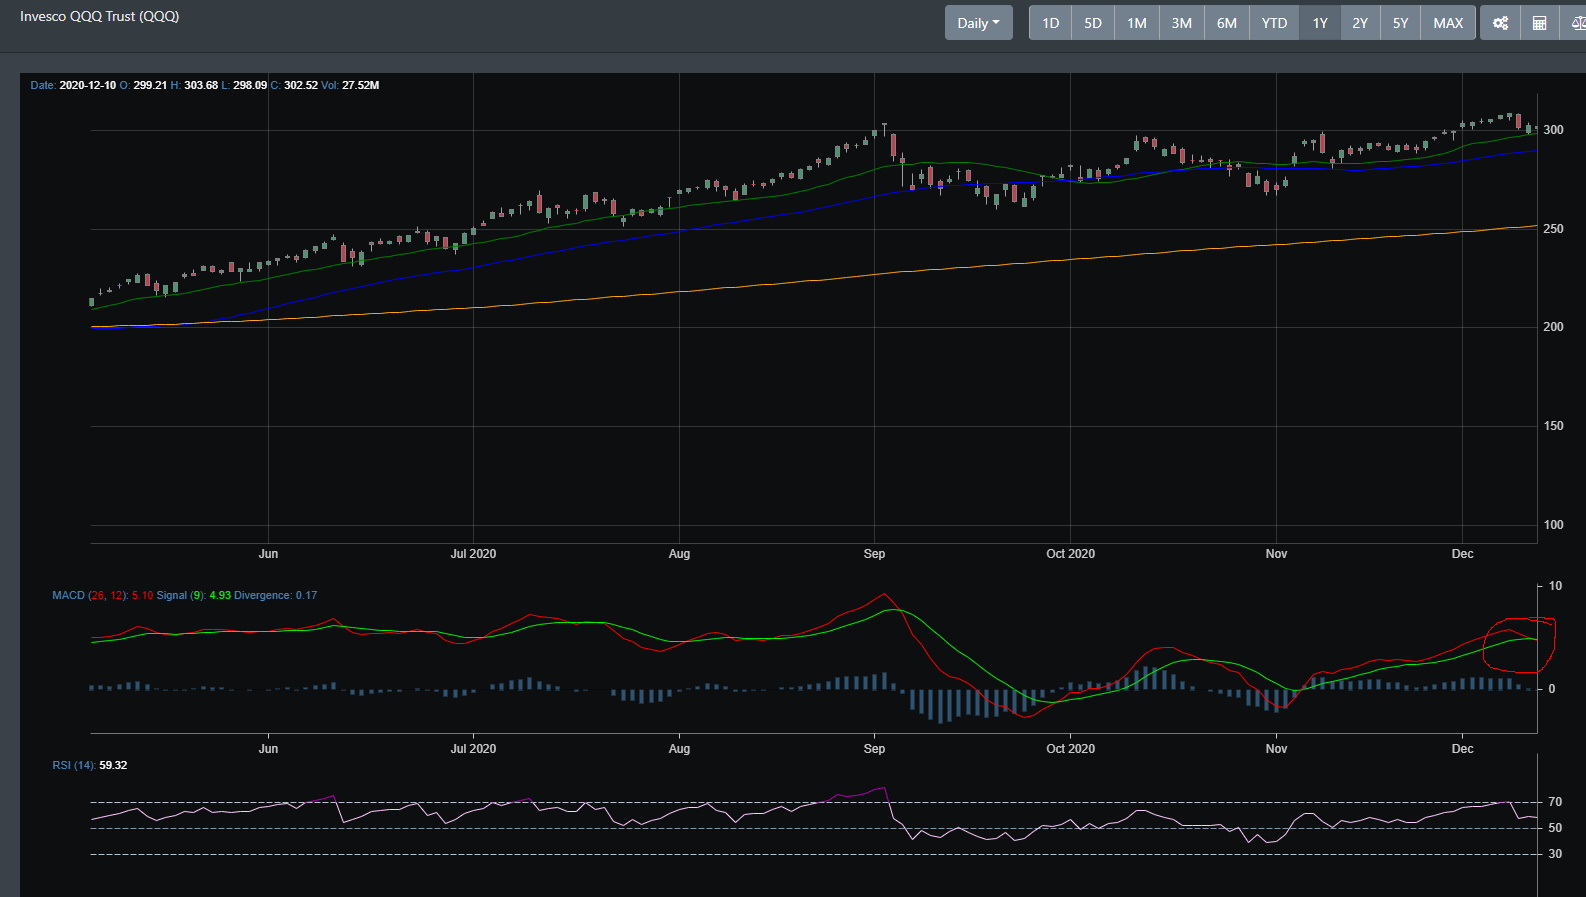
QQQ
MACD sell signal triggered below.
Concluding
Are we looking at a major correction coming into the market? Has the market already priced in the positive news from the vaccine? Are market participants looking further out toward a delay in stimulus talks? With momentum still firmly bullish and FOMO still currently being held by market participants, the likelihood of a major correction is low. As discussed in our last blog, major parts of the economy have recovered and are currently in an uptrend. The bulls are still currently in control and are looking at a Santa Claus rally.