


Sell In May and Go away
So, the saying "Sell in May and go away" really did not apply for the Summer of 2020. Markets in July and June saw all-time highs for all major indices. And August was no different.
Historically, the monthly returns on the S&P 500 for August are usually low. In fact, when running the numbers for the monthly return of August for the years from 1950 to 2019, we get 38 up years and 32 down years. The average return was at -0.26%. For the last few years, you can see that the month of August has been hardly great for the bulls.
| Year | August Monthly Percentage Return |
| 2019 | -2.39% |
| 2018 | 2.85% |
| 2017 | -0.11% |
| 2016 | -0.10% |
| 2015 | -6.29% |
In fact, summer has typically been considered the slow season for the markets. However, this has been an unusual year for the markets. August is on track to deliver one of the best performances in over 30+ years. The S&P 500 (SPY) is up 8% and the Down Jones Industrial Average (DIA) is over 9%. Nasdaq (QQQ) is over 12% and on track to post its best returns since 2000.
AAPL which has a 2 trillion dollar market cap help propel DIA. MGM resorts added over 60% in the month of August for SPY. And TSLA roared up 44% for QQQ in August alone!
Market Breadth versus Momentum
Lets first take a look at our Big Picture view of the market. 52 days ago (in July), the golden cross was triggered. Since then the S&P 500 and the major indexes have been on an upward trajectory. Market indexes are now trading a historical or making new highs. The percent of stock above the 20 DMA is over 66%. The percentage of stock above the 50 DMA is above 52%.
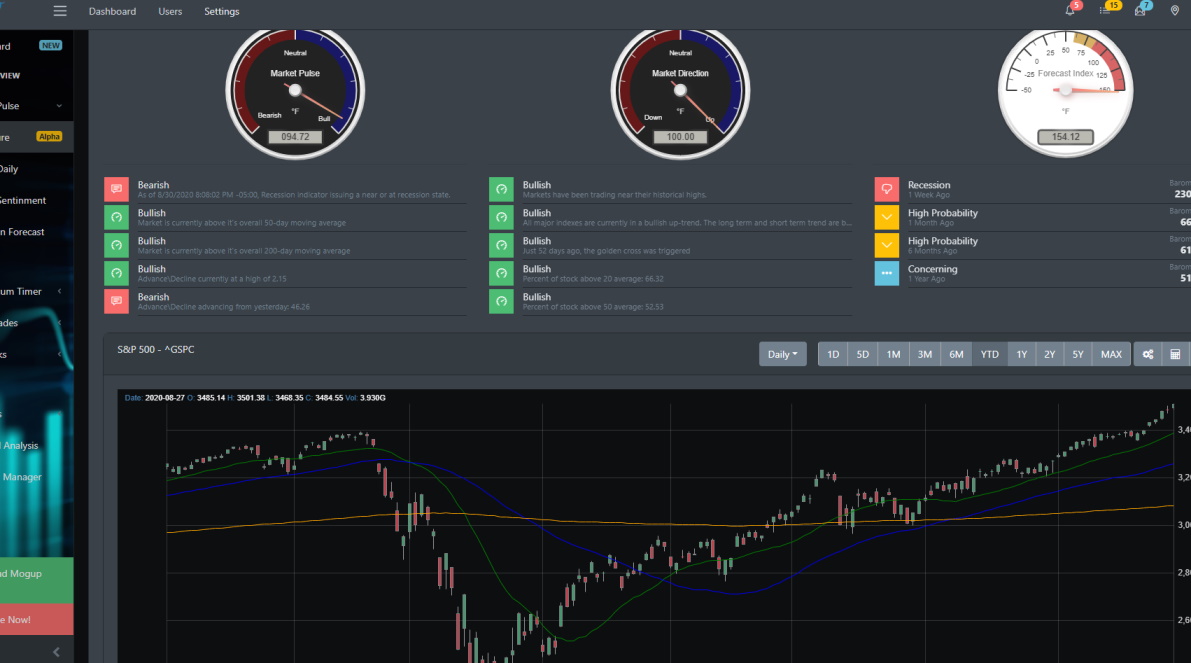
Clearly the market is in a major momentum. BullGap's momentum pulse and direction is at 94% and 100%. When the readings are at this level, it means the market is in a high momentum phase.
As the S&P 500 make new highs, it would usually follow that most stocks in the index follow suit. This has not been the case for July or August. In a strong market, market breadth would include at least 60% of stocks moving to all-time highs. The new high list has been getting narrower as the S&P 500 makes new all-time highs.
Market Sentiment vs Technical Readings
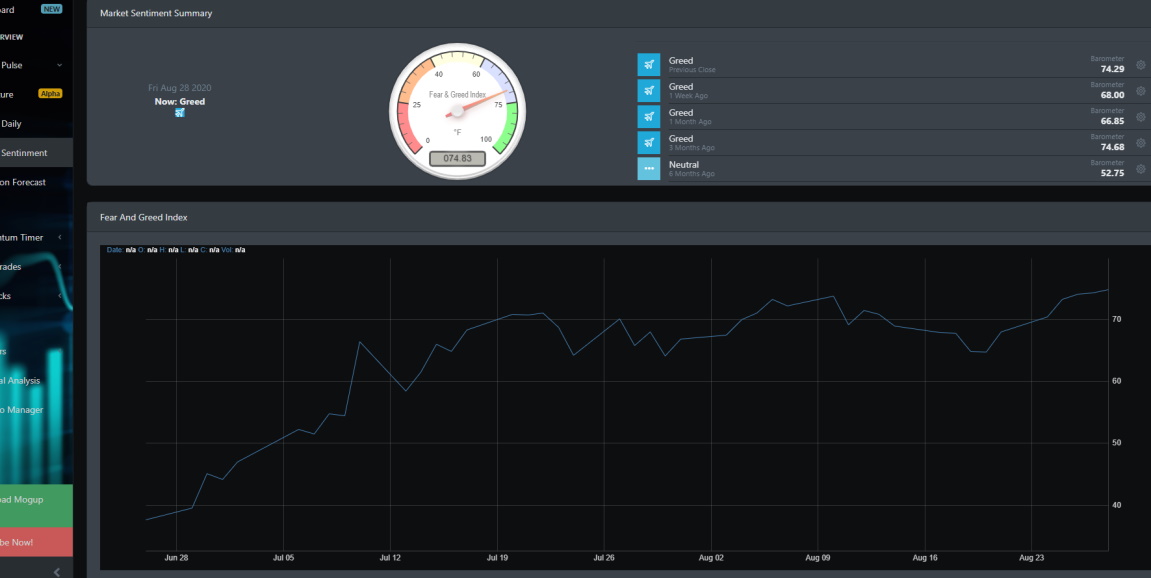
Technical readings on all major indexes are near a topping. The RSI, Stochastic and MACD and other readings are at high extremes. SPY and QQQ are trading at 3x to 4x their standard deviation. That said, BullGap's market sentiment reading shows a high exuberance in the market. The market has been in the "Greed" phase for the past month. It is currently reading 74.29. This a stark contrast from its last low on June 26, 2020, where it was at 37.63. The CBOE Options Total Put\Call Ratio (CPC) is showing historical lows. This typically indicates that investors are no longer hedging their portfolios against a correction.
Economy Standing
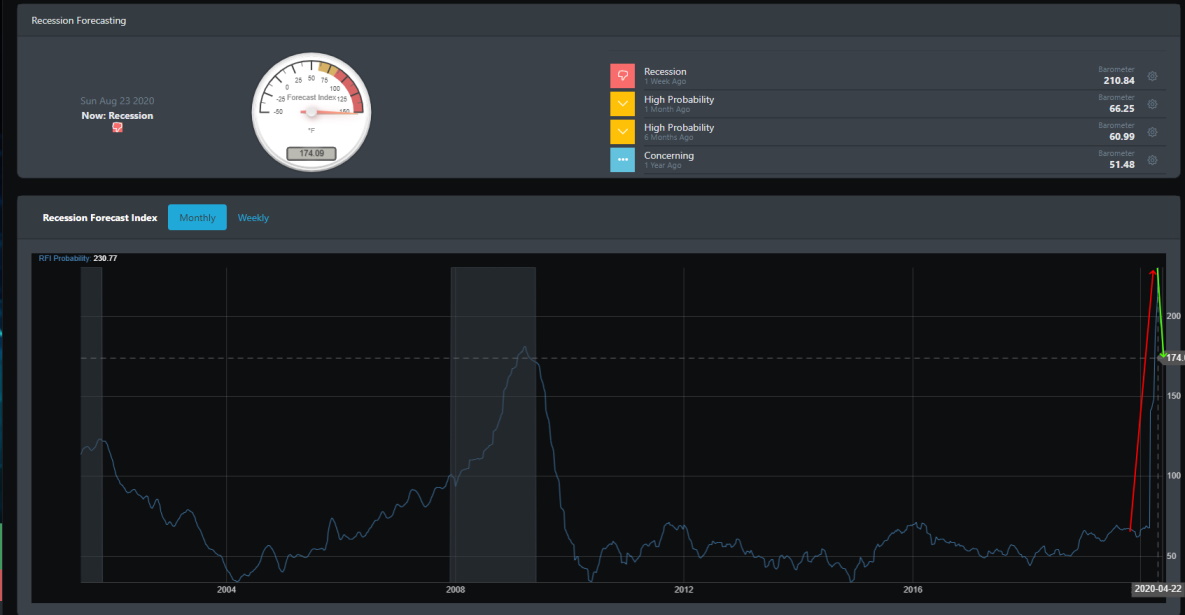
As discussed in our prior blogs, there is ample liquidity in the market. Looking at BullGap's recession index below, overall economic data shows vast improvement since its weekly high of 230.77 back on April 22, 2020. Though the U.S economy is clearly not out of the woods, the reading has dropped down to 174.09.
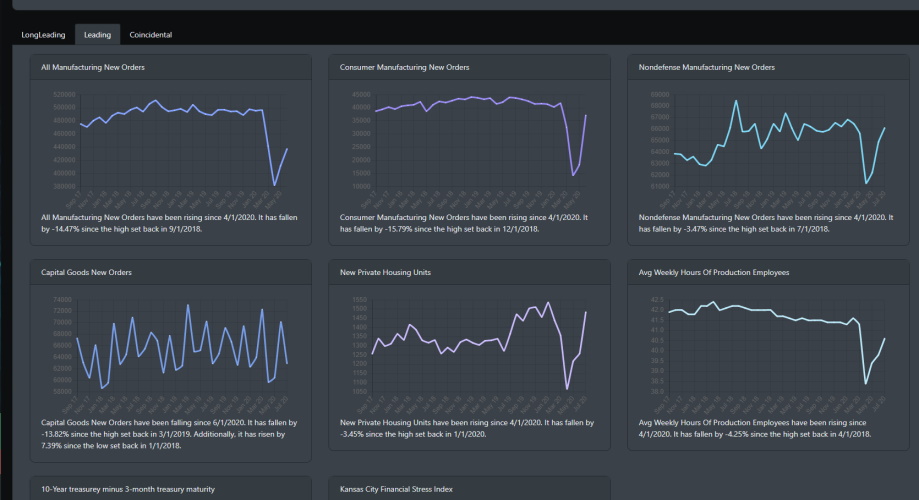
Leading economic indicators
The long leading, leading, and coincident economic indicators are all turning the corner. Manufacturing new orders, consumer manufacturing, non-defense manufacturing are almost at pre-pandemic levels. The labor market is still in the red, however. A positive note is that the yield curve is no longer inverted which indicates expansionary movement.
Market in Review
For the most part, the market this week was in the green. Large-caps (QQQ) led the way while tech, financials, and communication advanced strongly for the S&P 500.
On top of that, the bond market is seeing a sell-off. Support was broken this week and we can see TLT below its 50 DMA. Small caps IWM has a MACD sell signal and is currently trending sideways.
Conclusion
The economic data is showing improvements. The Federal Reserve has lowered rates and are committed to keep interest low. For the market, the sell-off in the Treasury is good news for the bulls. This is most likely indicating investors are moving cash into the equity market. Large caps are the winners again this week with investors betting that they will propel the economic recovery.