


Highs for both euphoria and the equity market. Several of BullGap's indicators (which we will discuss below) are reading overbought and terribly stretched to the upside. You cannot overemphasize the fact that Fear of missing out (FOMO) has kicked up a notch even with bad news regarding the vaccine supply chain problem and lower job growth - the market just kept on rallying. Last week was a solid week for the market. The S&P 500 closed at a new all-time weekly high and all major indices are positive for the week. In fact, the Russell 2000 has been up 23% since hitting late October and has rallied for 5 consecutive weeks.
It could be that the market is spinning the bad news of Pfizer's supply chain problems and Friday's poor employment report as meaning there will be an emphasis on pushing for a government stimulus package.
Big Picture
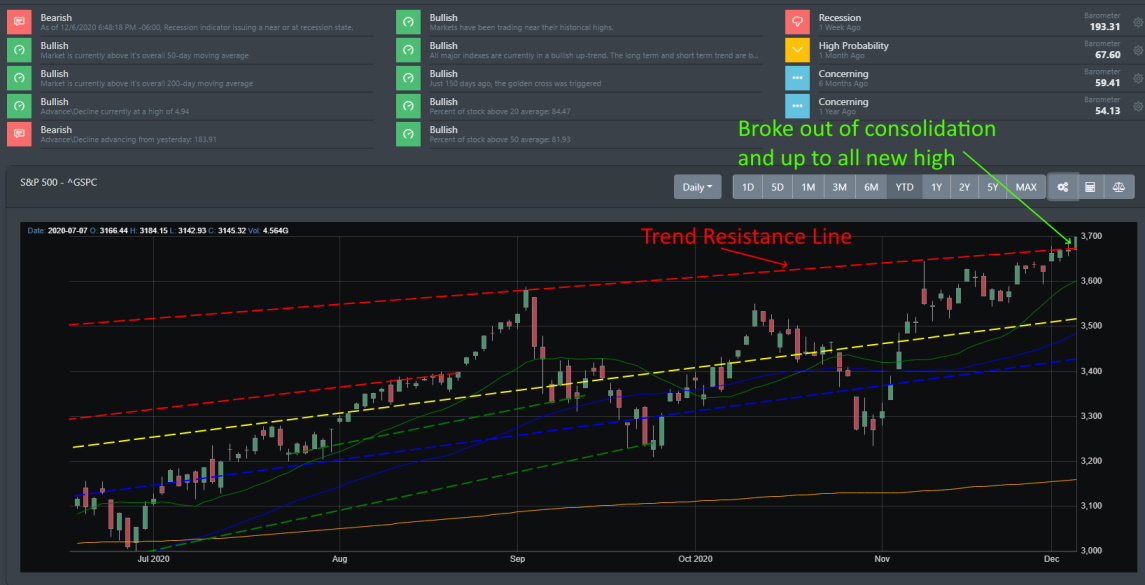
Forget about the current state of the job market and the rise in COVID cases because momentum is clearly driving factor in the market. The chart below shows the market breaking out of consolidation and have pushed to new highs. BullGap's automatic trend line analysis shows the market pushing passed resistance on Friday 12/4. The S&P 500 is hovering near a 3-standard deviation from it's 50 DMA.
Market Breadth
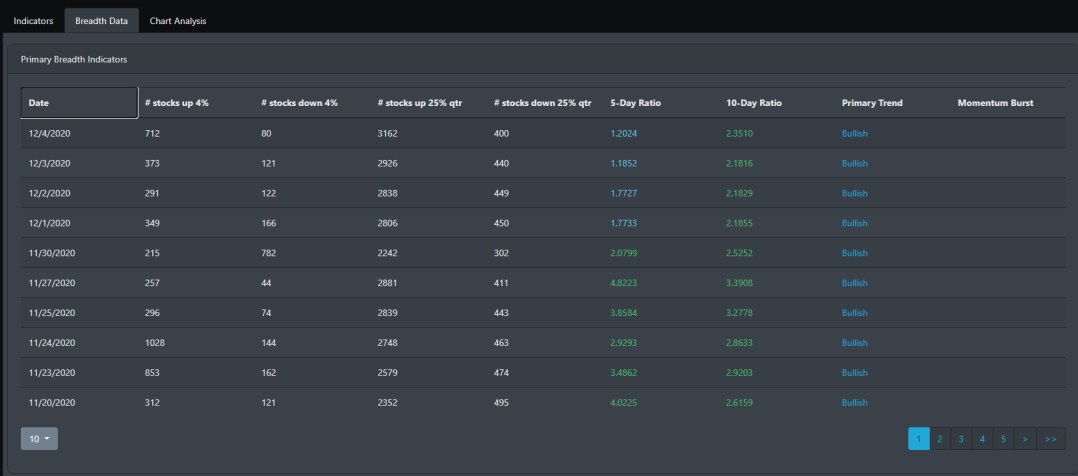
BullGap's market bread analysis has been signaling a strong bullish momentum since November 11 and the markets have cleared pushed to new highs since. Typically, once the 10-day ratio hits above a 2.0 reading and 5-day ratio starts accelerating, these have been historically tall tell signs of a large momentum swing to the upside.
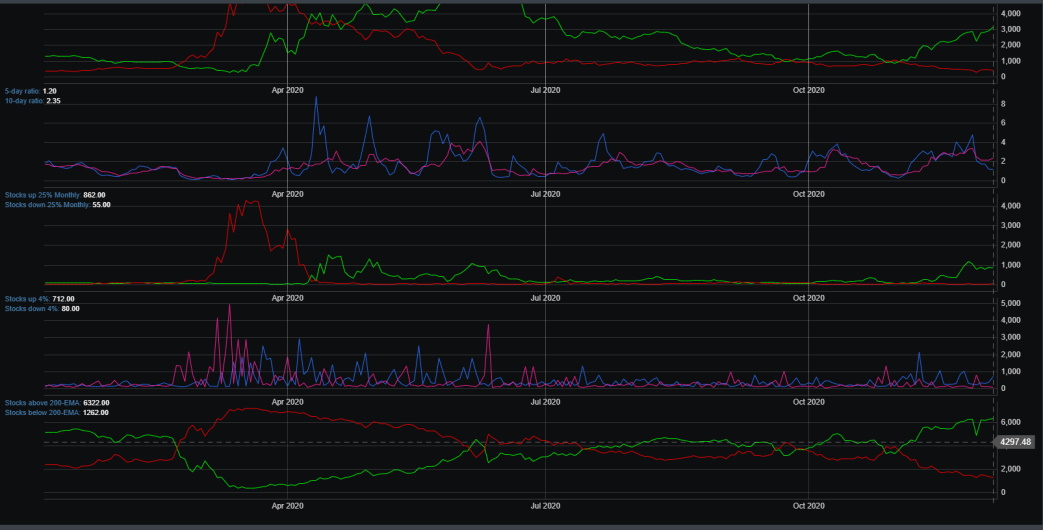
These are extreme bullish times as we are seeing a record level of stocks above their 200-DMA and EMA.
Market Sentiment
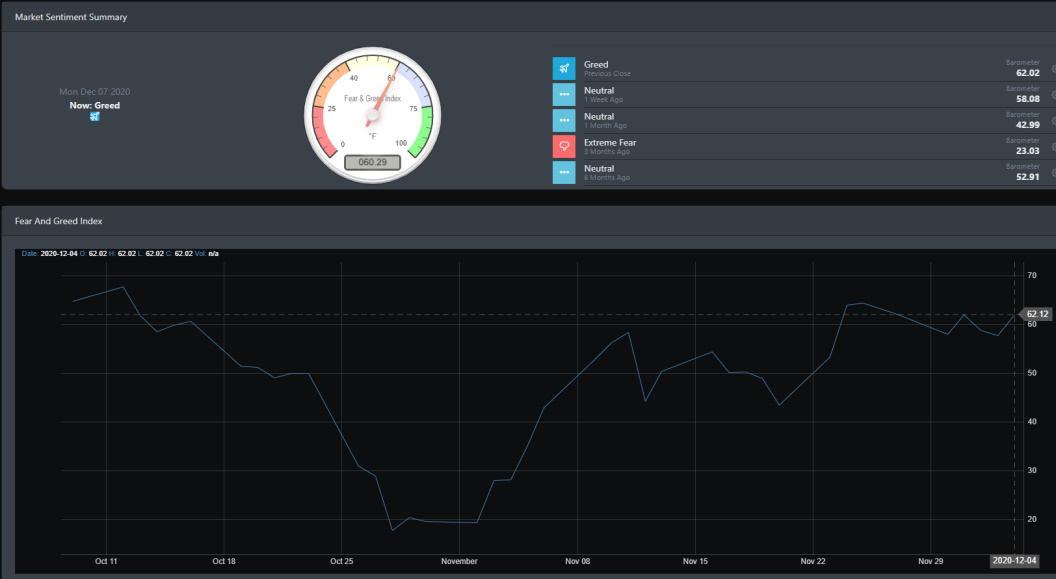
Market sentiment is clearly at extremes. As of the closing on 12/4, Bullgap's market sentiment was reading a 62.02 which historically is considered extreme. For this year alone, when the gauge hit above 67+ is when a short term correction ensued. A few recent gauge readings above 67 occurred on October 12 and August 28. Both occurrences coincided with a market correction a few trading days later.
Economic Outlook
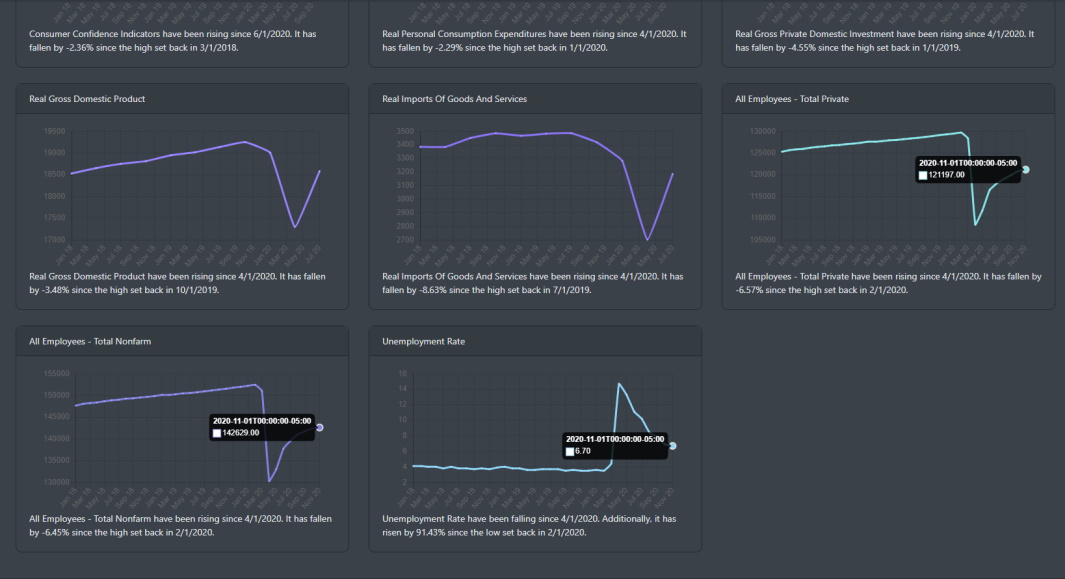
With GDP estimates from the Atlanta Fed showing 11.1% (well above consensus) and various parts of the economic data showing a V-shape recovery, it is clear we are on the right track to recovery. Looking at the chart below, M2 money supply growth is roughly +25% year over year. Corporate profits which were looking suspicious in our earlier blogs are clearly moving in an uptrend.
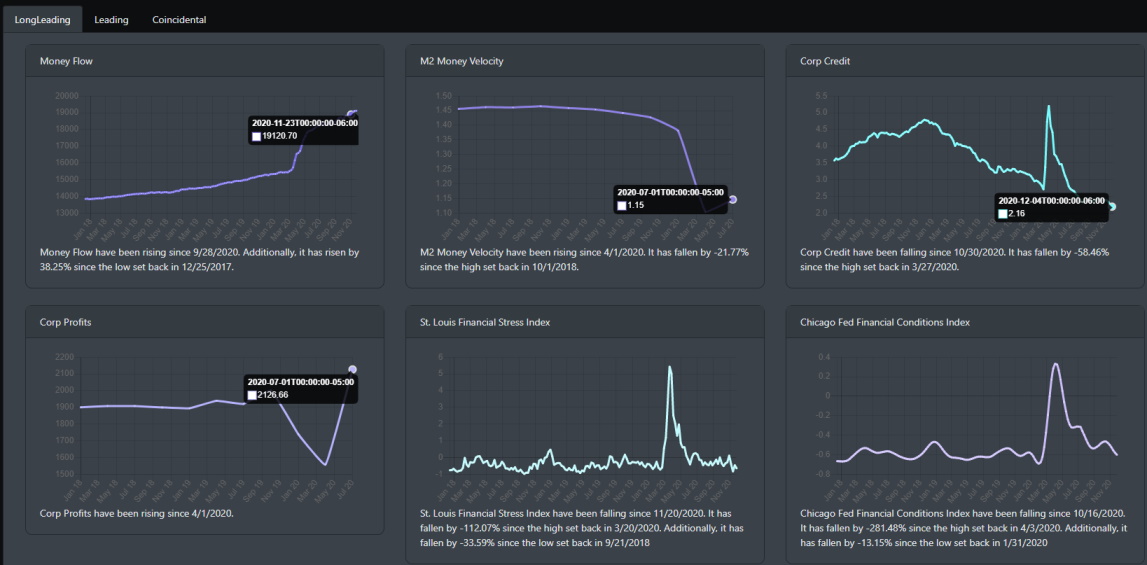
The outlier and probably what will keep the economy from making a rapid recovery is the labor market. Total nonfarm payroll employment rose by 245,000 in November. The unemployment landscape is historically high at 6.7 percent. With the potential of losing unemployment benefits and a deceleration in the pace of job growth, it could be quite damaging to an economic market that is trying to pull itself out of the pandemic.
Market Outlook
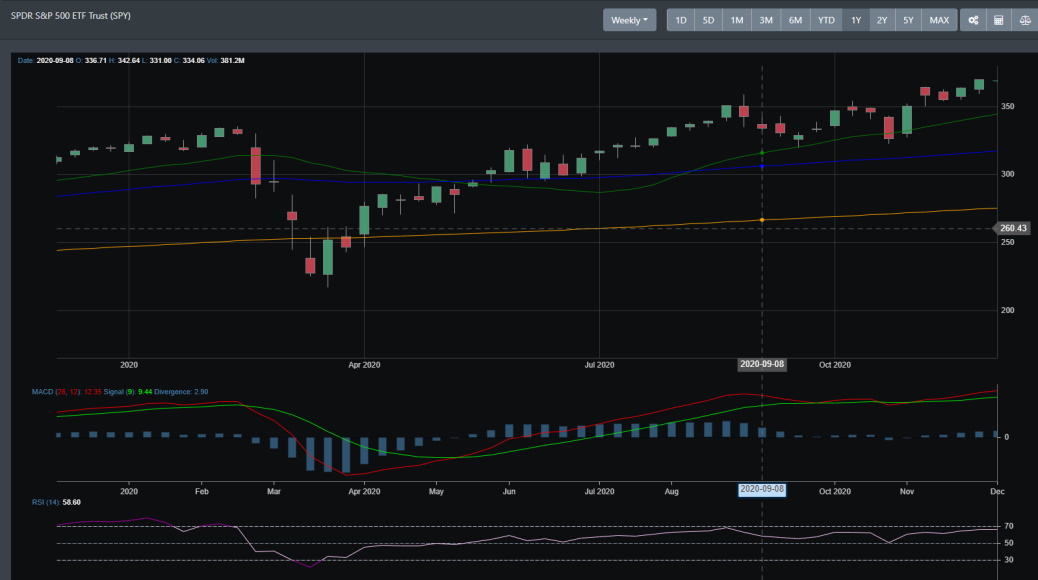
Records high are all in when the daily, weekly, and monthly charts are clearly bullish. Rotation is happening and the market is buying perceived bargain sales in stocks. From overvalued growth and into undervalued stocks, portfolio managers are betting that the stocks that were affected by COVID 19 will bounce back by next year. Below is the weekly chart of SPY and it clearly in an uptrend. The energy, bank, and defense sectors are making upward moves in the market.
Technically speaking the markets are stretched but MACD is in a buy signal, 200, 50 and 25 DMA are in an uptrend and stochastic is reading bullish demand.
Concluding
With these bullish extremes, there are various pundits expecting a near correction to occur in the market. What some may not be calling out is that there could possibly be a melt-up into the year-end. The short-term money has been made in the indices since the March lows. Now, the "dead" sectors\stocks are looking quite attractive as we head into next year. As it sits right now, we are seeing extremes in various areas. Put\Call ratios, bullish sentiments, a record number of stocks trading above their 200-DMA. These are often an indication of a coming market pullback. If we look at December historically, for the past 20 years markets have rallied over 90% of the time. With the US economy coming out of an amazing quarter (annualized rate of 33.1%) and the market shrugging off bad news last week, we could see a Santa Claus rally come to town by end of the year.