


The S&P 500 has hit all-time highs by surpassing the 5000 mark on January 12, 2024. During the fall of 2022, there was such pessimism and bearish market sentiment that there were only a few minority views that the market would reverse course and rally to where we are now. Some market pundits were forecasting that the S&P 500 would drop below 3500 at that time. Only a few saw a high potential for a market reversal, as evidenced by our blog on October 14, 2022 - A Contrarian bounce coming.
What was a microscopic minority viewpoint at the time is now the fad of today. Everyone is bullish. Even the sturdiest bears have now turned bullish. Everyone who called out markets would topple because of rampant inflation, impending recession, war, and social unrest has capitulated to the bulls. Everyone is now on the Bull Express. Because of this, the S&P 500 has realized a gain of over 40% since our October 2022 call.
Big Picture
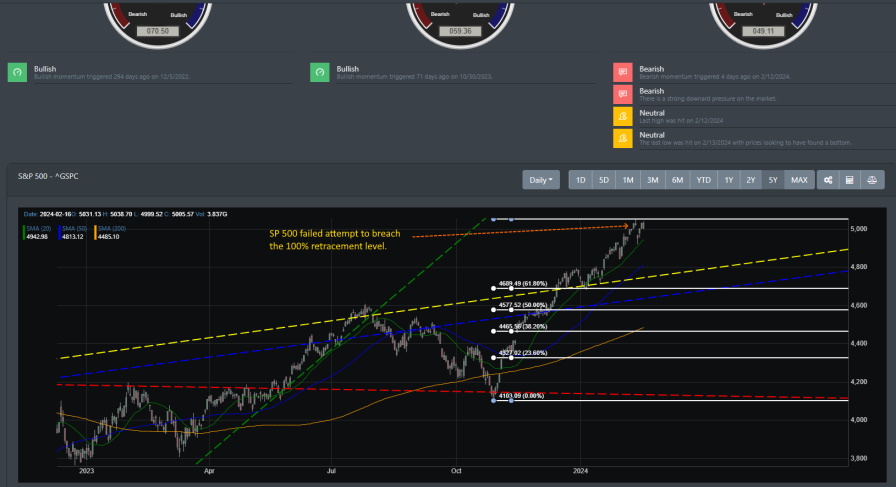
Looking at the last few months, it is clear that the bulls are now in firm control of the market narrative. The S&P has reached the 5000 mark, which can be seen as a psychological milestone for investors. Only six months ago, you could hear mainstream news calling for a market top and that the current rally was a farce. Though everything looks rosy for investors, technical divergence is now in play. Taking the Fibonacci retracement from the October 23 lows, we can see that the S&P 500 is now reaching the 100% level, which can be difficult to breach and maintain without a pullback or consolidation period.
Market Breadth
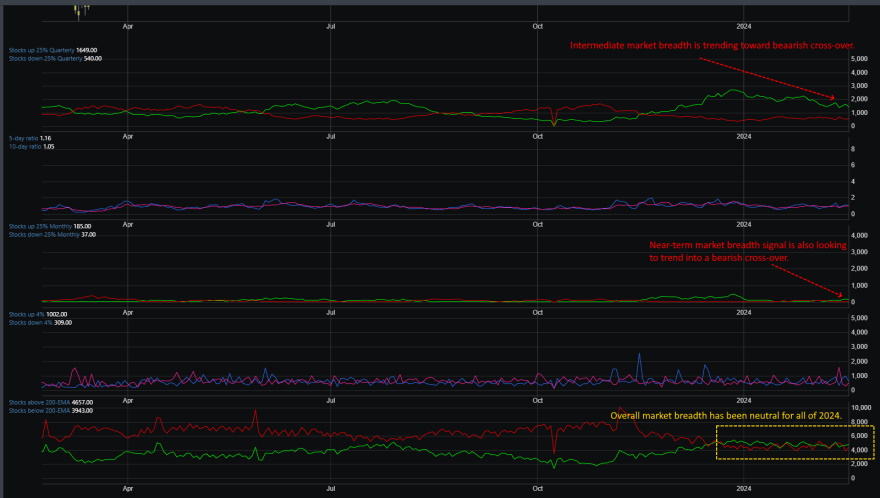
While markets are making new all-time highs, several divergences are in play. Looking at some of our market breadth readings, we can see that the intermediate signals have been trending into bearish territory. It has been trending lower into bearish territory since the start of 2024. However, markets have been pushing higher. Also, the near-term readings have yet to clearly cross over definitively to the bullish side and are now looking to reverse potentially. And for the overall stock universe, less than 55% of stocks are above their 50-day moving average (DMA), and fewer than 65% are above their 200 DMA. These essential divergences usually accompany market peaks.
Market Sentiment
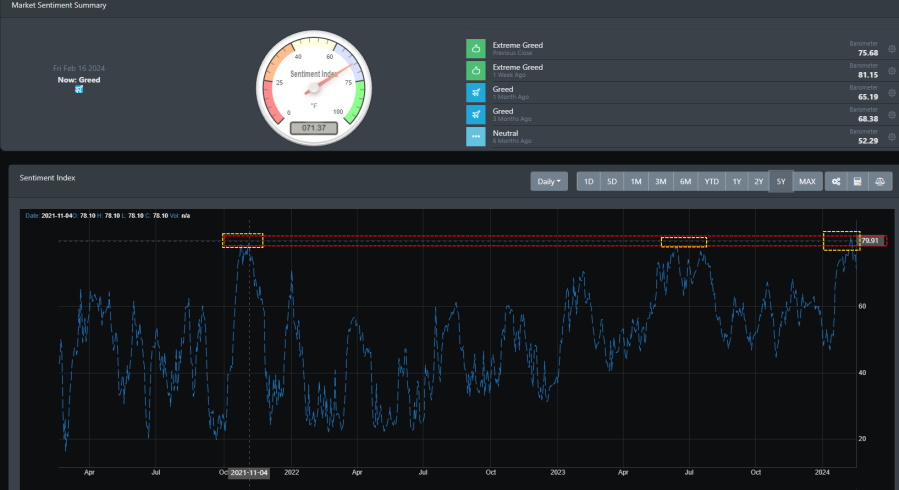
Extreme greed has been the game's name for the past few months. Since hitting January of this year, markets have been on a near-vertical trajectory. We took a 5-year snapshot of our market sentiment reading. We outlined vital turning points in the markets where a reversal occurred in the yellow box. Strong market rallies accompanied these critical points before eventually topping out and falling into a significant pullback. We can see that happen around November 2021, right before markets topped out into the 2022 market decline, and July 2023, when markets had a pullback before rallying again in the late fall of 2023. Now, we have a similar sign that could indicate a market sentiment reversal. It resembles our call back in October 2022 when market sentiment was bearish. Right now, everyone is optimistic. There will be a point when there is no one left to buy.
Market Outlook
The bull market is alive and well, with the most significant indices hitting all-new highs. There was some technical weakness this week as the CPI release jolted investors. However, there is no accurate read from this week, but to be fair, markets are now historically overstretched. Can markets push higher, or are we looking for a potential correction? Let's take a look at our charts from the weekly timeframe perspective.
SPY
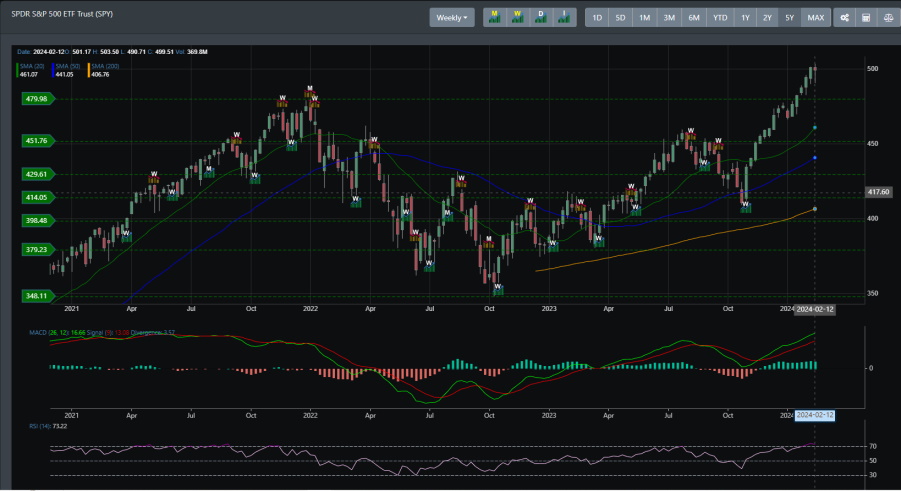
SPY is clearly in a strong uptrend. SPY has a near-vertical trajectory after receiving its monthly bullish buy signal on 11/1/2023 and weekly bullish buy signal on 10/30/2023. However, it is high overbought, and now the weekly RSI levels have hit a near high, suggesting that a pullback of any sort is needed to continue this rally.
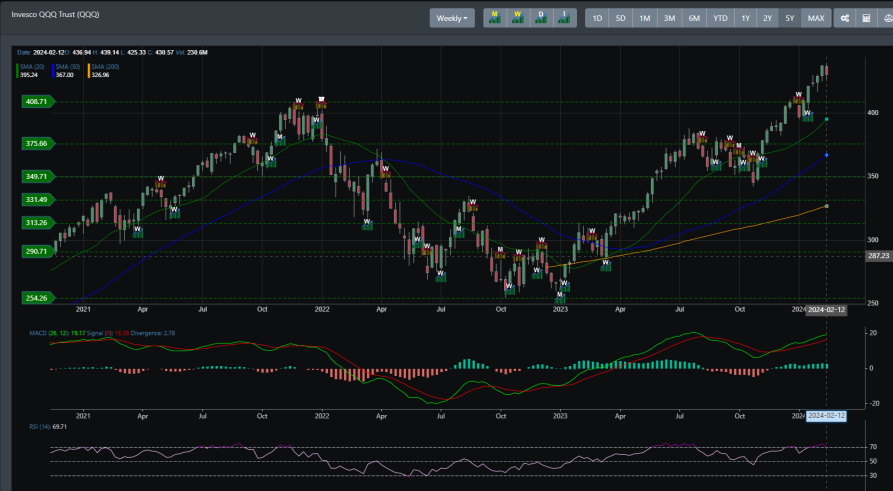
QQQ
Like SPY, QQQ is in a strong rally with a near-vertical ascent since receiving its monthly buy signal on 11/1/2023. On the daily reading, there is a divergence in play where the RSI has already topped and is declining while QQQ continues to rally higher. The weekly reading shows that QQQ is highly overstretched, and the weekly RSI is overbought territory.
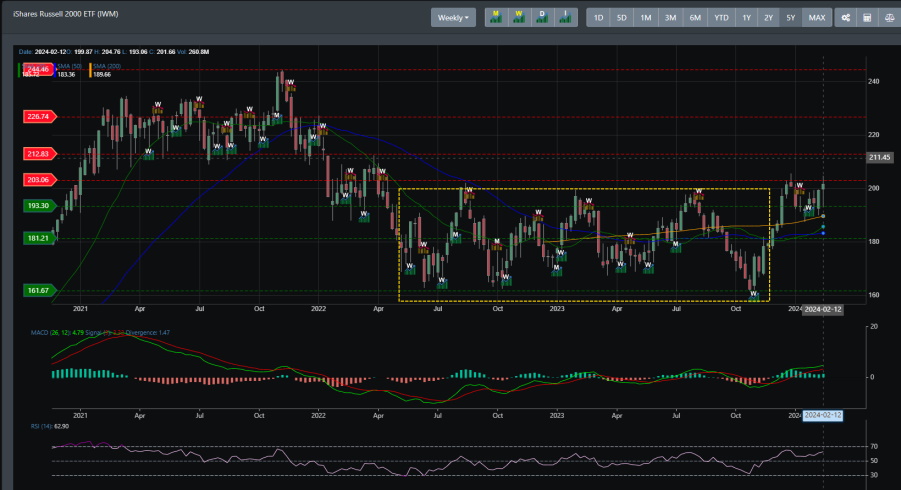
IWM
IWM right now has a look at a potential breakout. It has recently pushed away from its near +9 month bounded range (outline in the yellow dash box). This can be a solid critical development for the markets as it can suggest that the broader market is ready to participate in the rally. If you look at the IWM chart below, you can see that it has been ranged-bound since mid-April of 2022. Even after the CPI report came out, IWM had a minor pullback and has since started trading higher.
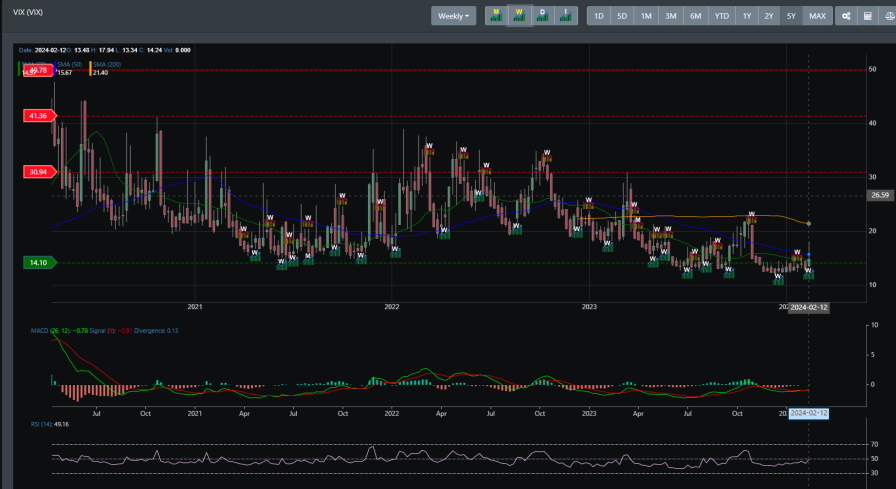
VIX
VIX has been dormant for most of 2024. Markets have since surged and rallied because low volatility levels indicate that investors are not concerned with an imminent market pullback. Bullish sentiment and a dormant VIX go hand in hand during a strong rally. However, things are looking attractive as the VIX recently issued a weekly buy signal, which suggests a pullback is on the table. Our weekly VIX reading also indicates a potential for a more substantial pullback.
Concluding
It is clear market participants are exuberant. But investors should be cautious as even the bears are now in full-blown FOMO mode. Several indicators suggest a market pullback is playing out, and that pullback could be here in the coming weeks. Only a little juice is left to keep this rally from continuing without a pullback. Resistance is now near the 5050 region, and if markets cannot push further, there should be a pullback where support is correct at the 4920 to 4950 region. If markets have a pullback and prices do not hold on near support, we may consider the 4800 region as the following line of support.